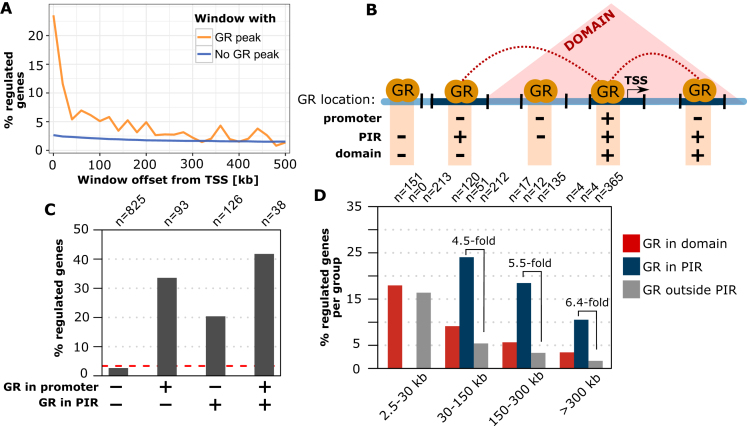
Figure 1.
Linking GR binding to the GR-dependent regulation of genes. (A) Percentage of genes regulated by GR in A549 cells (absolute log2 fold change (|log2FC|) upon dexamethasone treatment >0.5 and adjusted P-value (P-adj) < 0.01) versus distance between the TSS and the nearest active GR peak (orange curve). Genes were grouped in distance intervals of 20 kb. Genes without an active GR peak between the TSS and the end of the distance interval are shown as a blue curve. (B) Cartoon depicting the different regions that were used to test if the link between GR binding and gene regulation benefits from incorporating information regarding the 3D organization of the genome. Promoter regions: TSS of genes ±5 kb; PIR: promoter interacting region with increased contact frequencies with promoter regions based on Hi-C data (GEO: GSE92804); Domain: contact domains obtained from Hi-C. (C) Percentage of genes regulated by GR (|log2FC| > 0.5 and P-adj < 0.01) for different GR binding configurations: (i) without an active GR peak in the promoter region and all promoter interacting regions. The dashed red line represents the percentage of all genes that is regulated (ii) active GR peak in the promoter region only, (iii) active GR peak in PIR only and (iv) active GR peak in the promoter region and at least one PIR. (D) Percentage of genes regulated by GR (|log2FC| > 0.5 and P-adj < 0.01) for genes grouped by the location of the nearest active GR peak: (i) in a PIR (blue bars), (ii) in the same chromatin domain (red bars), and (iii) outside of PIRs (gray bars).

