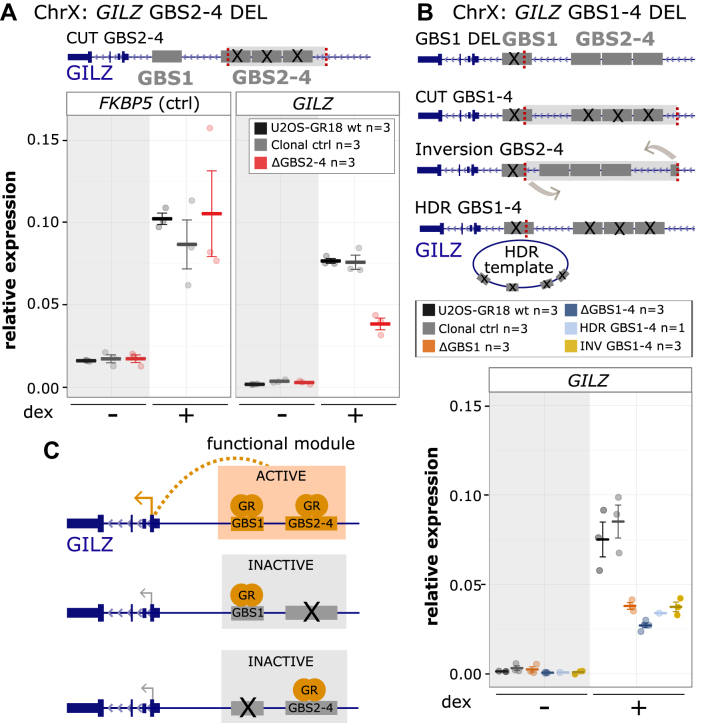
Figure 3.
Cooperative interactions between multiple GR binding sequences of the GILZ GBS1–4 enhancer. (A) Top: Schematics of the GILZ GBS1–4 enhancer locus with GBSs 1–4 highlighted in gray and the location of the gRNAs used to cut out GBS 2–4 in red. Bottom: Relative mRNA expression levels as determined by qPCR for the FKBP5 and GILZ genes are shown for wt U2OS-GR18 (n = 3), for clonal lines lacking a region containing GILZ GBSs 2–4 (n = 3) and unedited clonal lines (n = 3) as additional control. Circles indicate values for each individual clonal line. Horizontal lines and error bars: Averages ± SEM for cells treated with vehicle or 1 μM dex overnight. (B) Top: Schematics of the GILZ GBS1–4 enhancer and the various clonal lines that were generated to assess the role of the GBSs found at this locus, targets for gRNAs highlighted in red. Clonal cell lines with GBS1–4 deletion were either generated by cutting with two gRNAs or by using a homology directed repair (HDR) template to mutate each of the four GBSs by HDR. Bottom: Relative GILZ expression levels as determined by qPCR for clonal lines with GBS1 deletion (n = 3), cut GBS1–4 deletion (n = 3), inversion GBS1–4 (n = 3) and HDR GBS1–4 deletion (n = 1). Circles indicate values for each individual clonal line. Horizontal lines and error bars: Averages ± SEM for cells treated with vehicle or 1 μM dex overnight. (C) Cartoon depicting how the activity of the GILZ GBS1–4 enhancer depends on simultaneous GR binding at both GBS1 and GBSs2–4.

