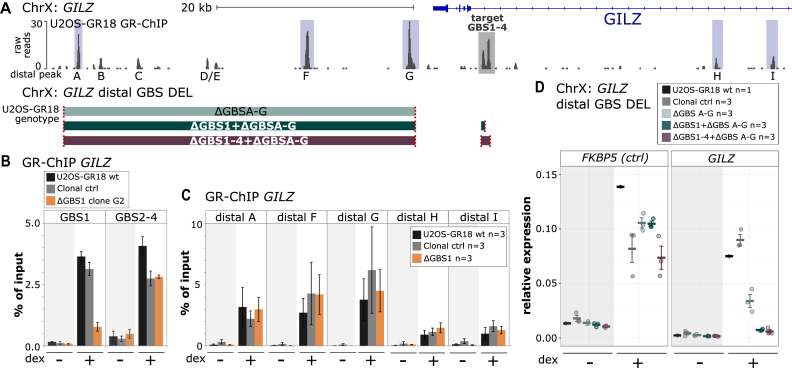
Figure 4.
Effect of GBS1 deletion on GR binding at the GILZ region. (A) Top: GR ChIP-seq tag density for dexamethasone (dex)-treated U2OS-GR18 cells stably expressing GR for the genomic region surrounding the GR target gene GILZ. The GILZ GBS1–4 enhancer is highlighted in gray. The main GR-ChIP peaks in the region selected for quantitative analysis by ChIP-qPCR are highlighted in blue. Bottom: Schematics of the generated clonal cell lines with deletions of a downstream region harboring several distal GR-peaks either alone or in combination with deletions at the GILZ GBS1–4 enhancer. The colored blocks correspond to the genomic regions (see panel a) targeted for deletion. The targets of the gRNAs are indicated in red. (B, C) GR occupancy levels for clonal lines as indicated was analyzed by chromatin immunoprecipitation followed by qPCR for cells treated with either dex (1 μM, 1.5 h) or ethanol as vehicle control. Average percentage of input precipitated ± SEM from three independent experiments for wild type cells, an unedited clonal control cell line and GBS1 deletion clone (G2) are shown. (D) Relative mRNA expression levels as determined by qPCR for the FKBP5 and GILZ genes are shown for wt U2OS-GR18 and clonal lines as indicated. Circles indicate values for each individual clonal line. Horizontal lines and error bars: Averages ± SEM for cells treated with vehicle or 1 μM dex overnight.

