Figure 6.
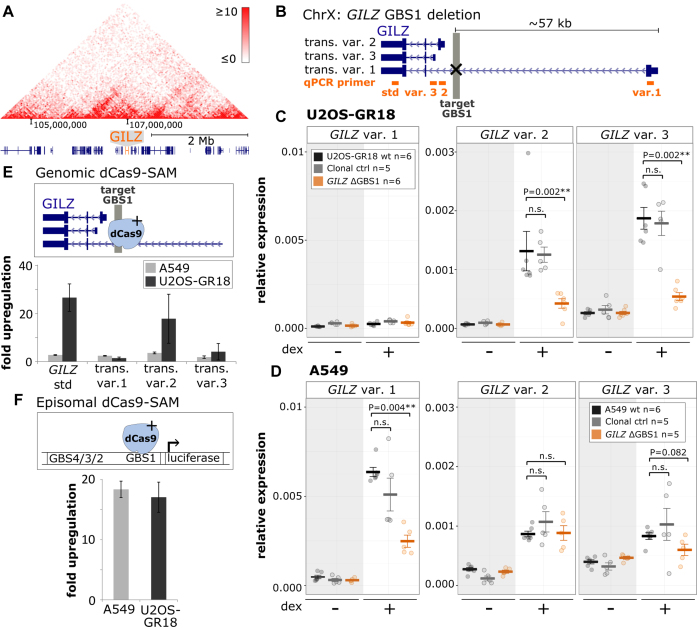
Cell type- and GILZ isoform-specific consequences of TF binding at the GILZ GBS1–4 enhancer. (A) Hi-C-derived intra-chromosomal contact frequencies for a region encompassing the GILZ gene at chromosome X for A549 cells (data from (47)). (B) Schematics of the GILZ locus, the deleted GBS1 (highlighted in gray) and three individual GILZ transcript variants that were analyzed using transcript variant-specific qPCR primers (target of primers highlighted in orange). (C) Relative mRNA expression levels in U2OS-GR18 cells as determined by qPCR for GILZ transcript variants as shown for wt U2OS-GR18, for clonal lines with deleted GILZ GBS1 (n = 6) or for clonal lines unedited at the GILZ locus. Circles indicate values for each individual clonal line. Horizontal lines and error bars: Averages ± SEM for cells treated with vehicle or 1 μM dex overnight. Unpaired two-sided Mann-Whitney U test: n.s. not significant, *P < 0.05, **P < 0.01, ***P < 0.001. (D) Same as for (C) except that data is shown for A549 cells. (E) Comparison between U2OS-GR18 and A549 cells of the transcriptional induction of endogenous GILZ transcript variants by dCas9 synergistic activation mediator (dCAS9-SAM). Average fold induction by targeted recruitment to the GILZ GBS1 relative to gRNAs targeting other loci ± SEM (n = 3) is shown. (F) Comparison between U2OS-GR18 and A549 cells of the transcriptional induction by dCas9-SAM of a transiently transfected luciferase reporter harboring the GILZ promoter region, including GBS1–4 and the endogenous GILZ transcript variant 2 promoter. Average fold induction by targeted recruitment to GILZ GBS1 relative to a gRNA that targets dCas9-SAM to another chromosome ± SEM (n = 3) is shown.

