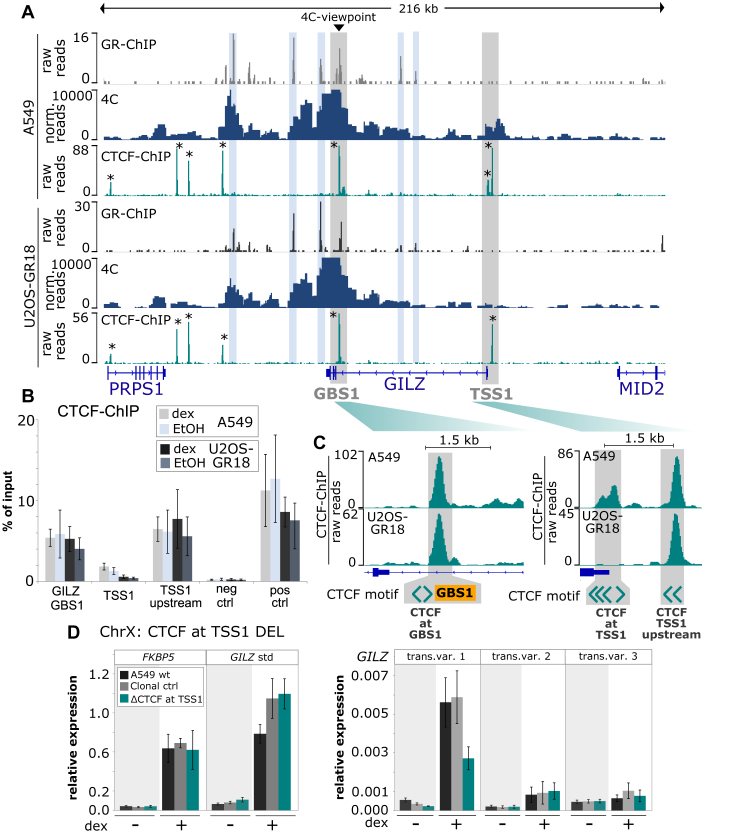
Figure 7.
Cell type-specific 4C-seq and CTCF binding profiles. (A) GR ChIP-seq, 4C-seq and CTCF ChIP-seq for a 216 kb region encompassing the GILZ gene are shown for (top) A549 and (bottom) U2OS-GR18 cells treated with dexamethasone. The GILZ GBS1 viewpoint for the 4C experiment and the promoter region of transcript variant 1 (TSS1) are highlighted in gray, GR-bound regions in blue and CTCF-bound regions with an *. (B) ChIP-qPCR of CTCF-binding at GILZ GBS1 and around GILZ TSS1 in wild type U2OS-GR18 and A549 cells. Average percentage of input immunoprecipitated ± SEM (n = 3) are shown for cells treated with vehicle (EtOH) and for cells treated for 90 minutes with 1 μM dex. (C) Zoom-in and schematic representation of CTCF binding, GBS1 and the location and orientation of CTCF motif-matches at the GILZ GBS1 and TSS1 regions. (D) Relative mRNA expression levels in A549 cells as determined by qPCR for FKBP5 and GILZ transcript variants as indicated for wt A549, for the clonal cell line with deleted CTCF motifs at the promoter region of GILZ transcript variant 1 or for clonal lines unedited at the GILZ locus. Averages ± SEM are shown for three independent experiments in cells treated with vehicle and for cells treated overnight with 1 μM dex.

