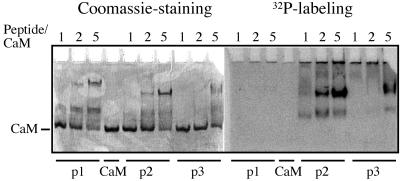
Figure 8.
CaM band shift assay. CaM and peptides, corresponding to peaks 1 to 3 in Figure 7, were incubated at the molar ratios indicated in the presence of urea and Ca2+. The complex formation was analyzed in a Ca2+-containing urea gel. The peptides from peaks 1, 2, and 3 are labeled p1, p2, and p3, respectively.

