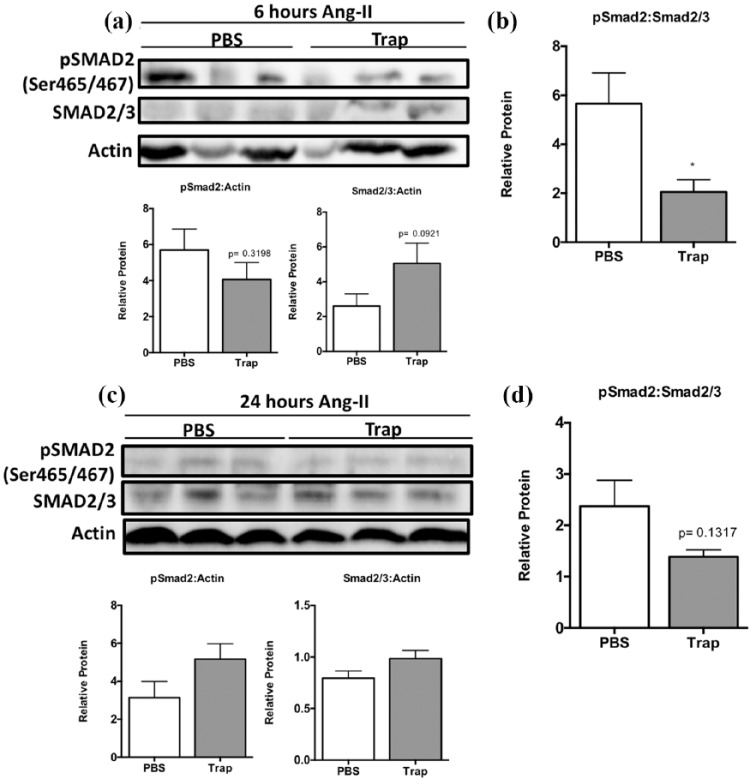
Figure 8.
TGF-β trap administration to partially reduced Ang-II-induced elevation of phosphorylated Smad2 levels at six hours. (a) Representative western blot images and semi-quantification using densitometry of pSmad2 and total Smad2/3 protein levels relative to actin at six hours. (b) Densitometry was used for semi-quantification of pSmad2 levels relative to total Smad2/3 protein levels. (c) Representative western blot images and semi-quantification using densitometry of pSmad2 and total Smad2/3 protein levels relative to actin at 24 hours. (d) Densitometry was used for semi-quantification of pSmad2 levels relative to total Smad2/3 protein levels.
Data are expressed as means ± SEM and normalized to actin.
n = 5–6.
*p < 0.05, compared to saline control.
Ang-II: Angiotensin II; PBS: phosphate-buffered saline; pSMAD2: phosphorylated Smad2; Ser: serine; Trap: TGF-β trap; TGF-β: transforming growth factor-β.

