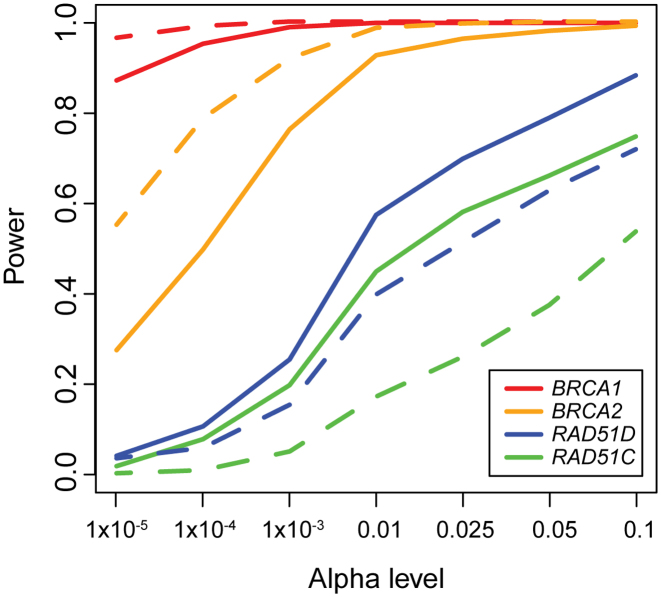
Figure 5.
Power estimation for association tests using XPAT. The lines depict the power comparisons with VAAST 2 analysis with XPAT using TCGA ovarian cancer cases and NDAR controls (solid lines) and using platform-matched ovarian cancer cases and controls (dashed lines), for four genes: BRCA1 (red), BRCA2 (orange), RAD51D (blue), RAD51C (green). The x-axis shows the α level and the y-axis shows the statistical power. The power was calculated based on 1000 bootstraps. For each bootstrap, we sampled 250 cases and 1000 controls with replacement from each dataset.

