
Figure 2.
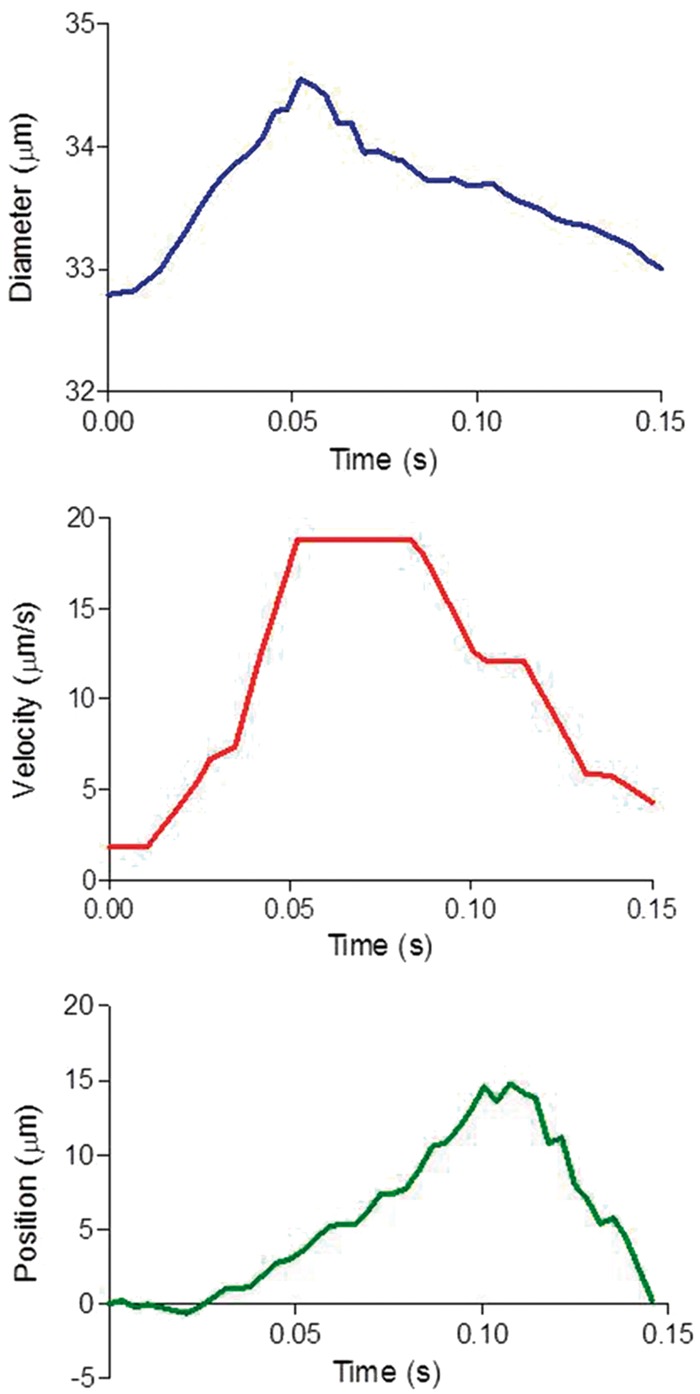
Ensemble average of diameter, blood velocity, and microsphere position. The ensemble average was constructed from a typical recording over 2 s. All parameters showed a pulsatile pattern attributable to the heartbeat. The microspheres showed a to and fro movement during the cardiac cycle. Position of the microsphere indicates the deviation from the net forward trend.