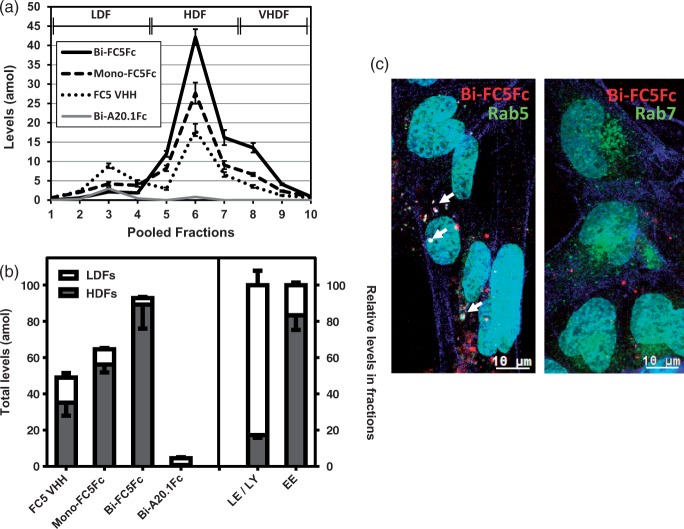
Figure 4.
LC-SRM quantification and fluorescent tracking of VHH-Fc fusion proteins in SV-ARBEC endosomes. (a) Absolute levels of FC5 VHH, Mono-FC5Fc, Bi-FC5Fc and Bi-A20.1Fc in endosome fractions of SV-ARBEC cells incubated separately with each of the antibodies (5 µg/ml, 45 min) and measured using LC-SRM. Absolute levels are presented in attomoles (amol) corrected to 1 µg of total endosomal protein from at least three endosome preparations (mean ± SD). Fractions corresponding to LDFs and HDFs are also indicated. (b) Levels in LDFs and HDFs as determined by LC-SRM. Total levels of the three antibodies are shown on the left and the mean percentage of the markers of late endosomes/lysosomes (LE/LY) and early endosomes (EE) are shown on the right. Shown are mean ± SD from three independent endosome preparations. LE/LY markers include M6pr, Rab 7,11 and Lamp 1, 2. EE markers include Rab 5a, Eea1. (c) Co-localization (white; indicated by white arrows) of Cy5.5-labeled Bi-FC5Fc (red) with endosome markers in RFP-Rab5 (left panel) and RFP-Rab7 (right panel) (both in green) – transduced BEC. Actin filaments labeled with Alexa Fluor 488 Phalloidin are shown in blue. Nuclei are labeled with Hoechst (shown in turquoise). Cells were transduced and internalization studies performed as described in Materials and Methods. Micrographs are representative of three independent experiments.

