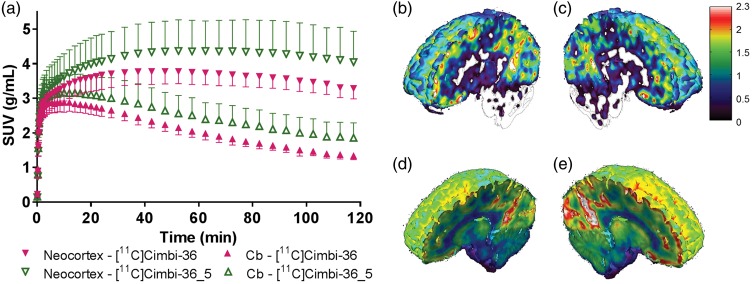
Figure 2.
(a) Standard uptake values (SUV) in neocortex and cerebellum (Cb) for [11C]Cimbi-36 and [11C]Cimbi-36_5 (points represent mean ± SD, n = 6). On the right: Maps of BPND (b and c) and corresponding SUV images (d and e) in one subject scanned with [11C]Cimbi-36 (b, d) and [11C]Cimbi-36_5 (c, e).

