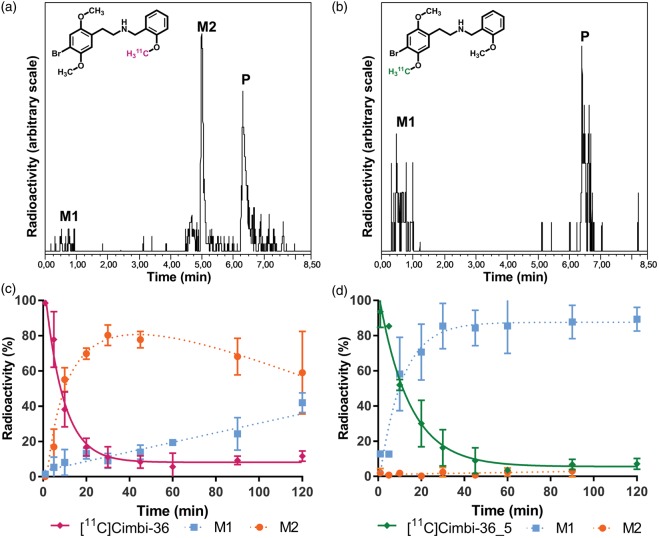
Figure 3.
Radio-HPLC analysis of plasma samples 10 min after injection of [11C]Cimbi-36 (a) and [11C]Cimbi-36 _5 (b). Peaks: M1 – polar radiometabolites, M2 – 5′-O-glucuronide, P – parent compound. Plasma radiometabolite profiles for [11C]Cimbi-36 (c) and [11C]Cimbi-36_5 (d) throughout the scan (means ± SD).

