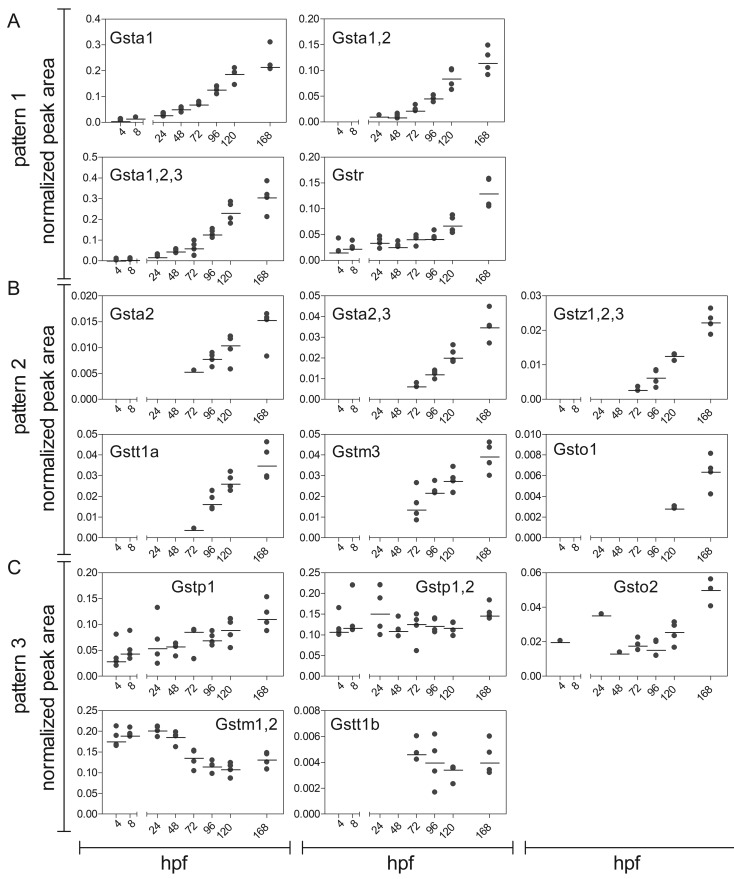
Figure 4.
GST expression in zebrafish embryos and larvae. The graphs are sorted in accordance to the expression patterns described in Figure 3. Data are shown as peak area normalized to the housekeeping protein GAPDH at 4, 8, 24, 48, 72, 96, 120, and 168 hpf. Each replicate (a sample of 60 pooled embryos) is shown in addition to the median (black line). For visualization, the normalized peak area of peptides belonging to the same enzyme (in case of proteotypic peptides) or several isoenzymes from the same class (in case of shared peptides) were cumulated. The number and characteristics of the cumulated peptides are summarized in Supplementary Tables 2 and 5.

