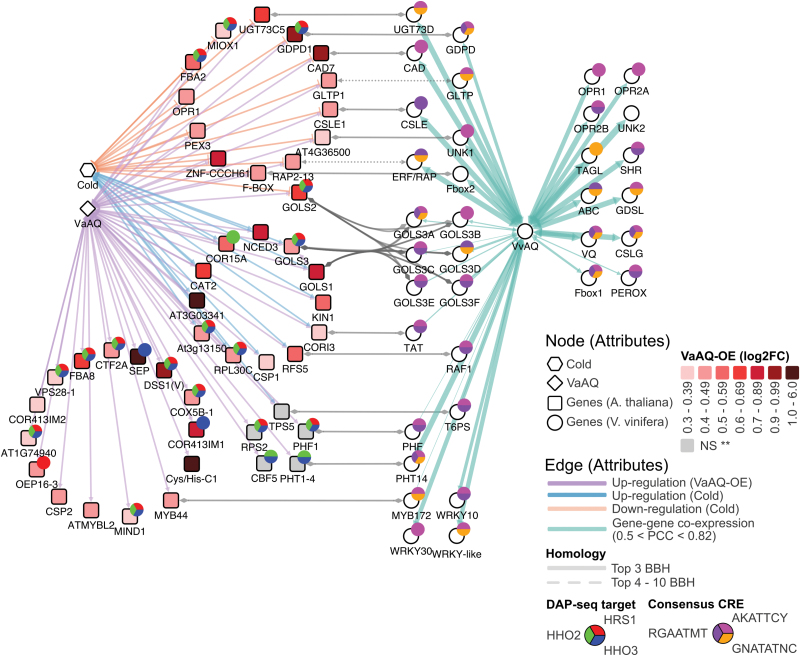
Fig. 7.
Interspecies regulatory and community gene co-expression network of AQUILO (AQ). Arabidopsis genes (square nodes) induced by VaAQ overexpression and differentially regulated by cold (unless denoted) are shown in the subnetwork in the left panel, while grapevine genes (circle nodes) co-expressed with VvAQ in public RNA-Seq data sets are depicted on the right. Arabidopsis nodes are colour-mapped from light to dark red according to the ascending fold change differences (log2FC) identified in the 35S:AQ-Stress versus WT-Stress RNA-Seq comparison. Grey nodes represent a major up-regulation in the 35S:AQ-Stress versus WT non-stress comparison. The light orange and blue edges connecting the cold hexagon node and Arabidopsis genes represent significant (FDR <0.05) down-regulation and up-regulation of the latter by the cold treatment. Grey edges connecting Arabidopsis and grapevine genes of the two subnetworks represent high confidence cases of orthology as suggested by biosequence analysis using profile hidden Markov models (pHMMERs). Circle nodes shown as pie charts alongside Arabidopsis genes indicate whether genes are AtHRS1, AtHH2, and/or AtHHO3 direct targets (derived from the re-analysis of DAP-Seq data generated by O’Malley et al., 2016). Pie charts alongside grapevine genes (on the right) represent the presence of G2-type and PBS1 consensus CREs present in the promoter region of the respective co-expressed gene. Edge thickness in the grape co-expression subnetwork represents significant co-expression between VvAQ and each gene ranging from 0.5 to 0.82 PCC. Gene IDs can be found in Supplementary Table S8.

