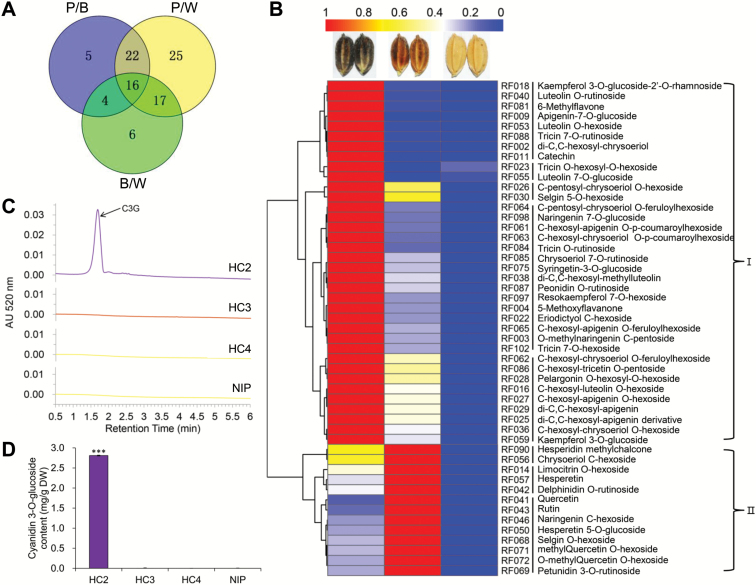
Fig. 5.
Flavonoid-targeted metabolome analyses of differently colored hulls. (A) Venn diagram showing the numbers of differentially accumulated metabolites in three kinds of colored hulls. P/B indicates differences between purple and brown colored hulls, P/W indicates differences between purple and straw-white hulls, and B/W indicates differences between brown and straw-white hulls. (B) Hierarchical clustering analysis of relative differences of flavonoids in purple, brown, and straw-white hulls. The relative content of each bin was normalized to unit variance and visualized by color. Red indicates high flavonoid abundance; blue indicates low abundance. The flavonoids are listed in Supplementary Table S7. (C) HPLC analysis of anthocyanin content recorded at 520 nm in extracts from hulls of NILs HC2 (CSA-type, purple hull), HC3 (CSa-type, brown hull), HC4 (cSA-type, straw-white hull), and Nip. Cyanidin 3-O-glucoside (C3G) showed a peak at 1.68 min. (D) C3G content. ‘DW’, dry weight. Error bars are ±SD (n=3). ***P<0.001 (Student’s t-test).

