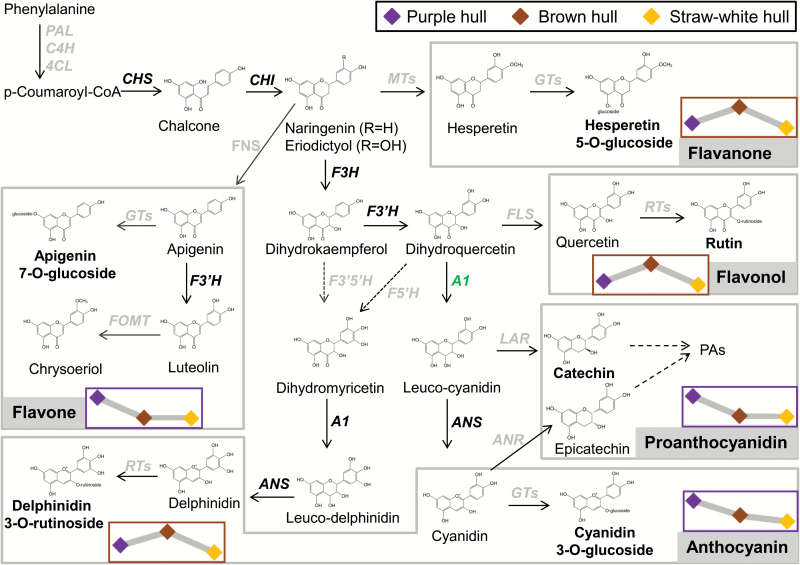
Fig. 6.
Schematic representation of the flavonoid biosynthesis pathway in rice. Flavonoids were divided into five groups that are indicted by grey shading. Genes encoding the related enzymes are italicized, and genes with well-known function in the flavonoid biosynthesis pathway are shown in bold. The highest accumulations of flavonoids in purple or brown hulls are indicated by purple or brown box borders, respectively. Line charts within boxes indicate the relative flavonoid content in the three kinds of hull.

