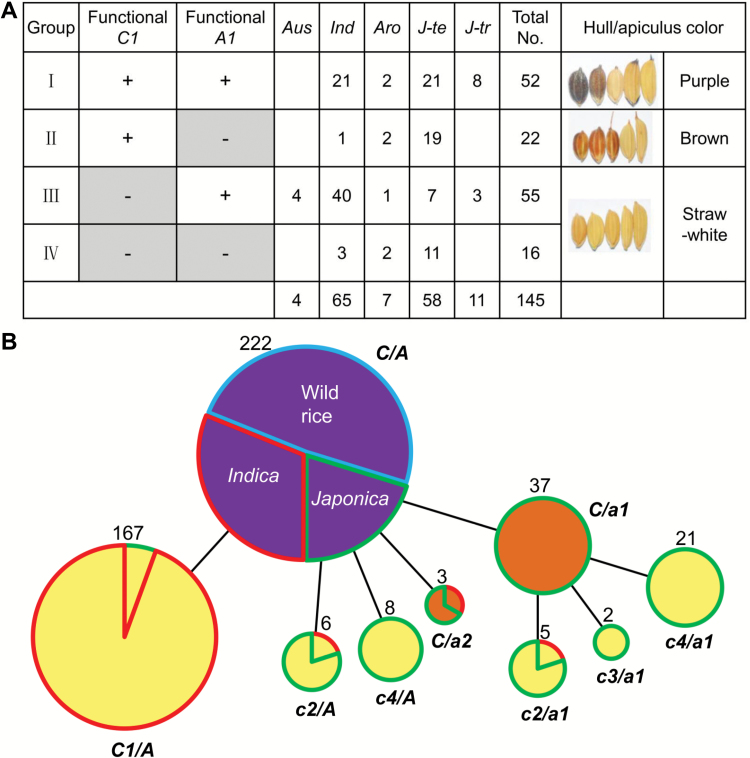
Fig. 7.
Combinational haplotype analysis of C1 and A1 in germplasm reveals the evolution of color. (A) Analysis of haplotype combinations of the C1 and A1 genes in lines with hull or apiculus color. One hundred and forty-five varieties were divided into four groups (I–IV) by C1 and A1 genotypes. ‘+’ indicates the functional genotype, ‘−’ indicates the non-functional genotype. Aro, aromatic; Ind, indica; J-te, temperate japonica; J-tr, tropical japonica. Representative phenotypes of varieties in each group are shown. (B) Evolution of rice color. Colors within circles represent the variety color phenotypes. Circle size is proportional to the number of samples with a given haplotype. The number near the circle represents the total number of samples in the group. Colors surrounding circles indicate taxonomic subgroups of varieties: wild rice is blue, indica is red, and japonica is green. Functional mutations in C1 are labeled c1, c2, c3, and c4, and represent the 10 bp deletion, 2 bp deletion, 3 bp deletion, and sub1, respectively. a1 and a2 represent functional mutation sites of hap10 and hap12 in A1, respectively.

