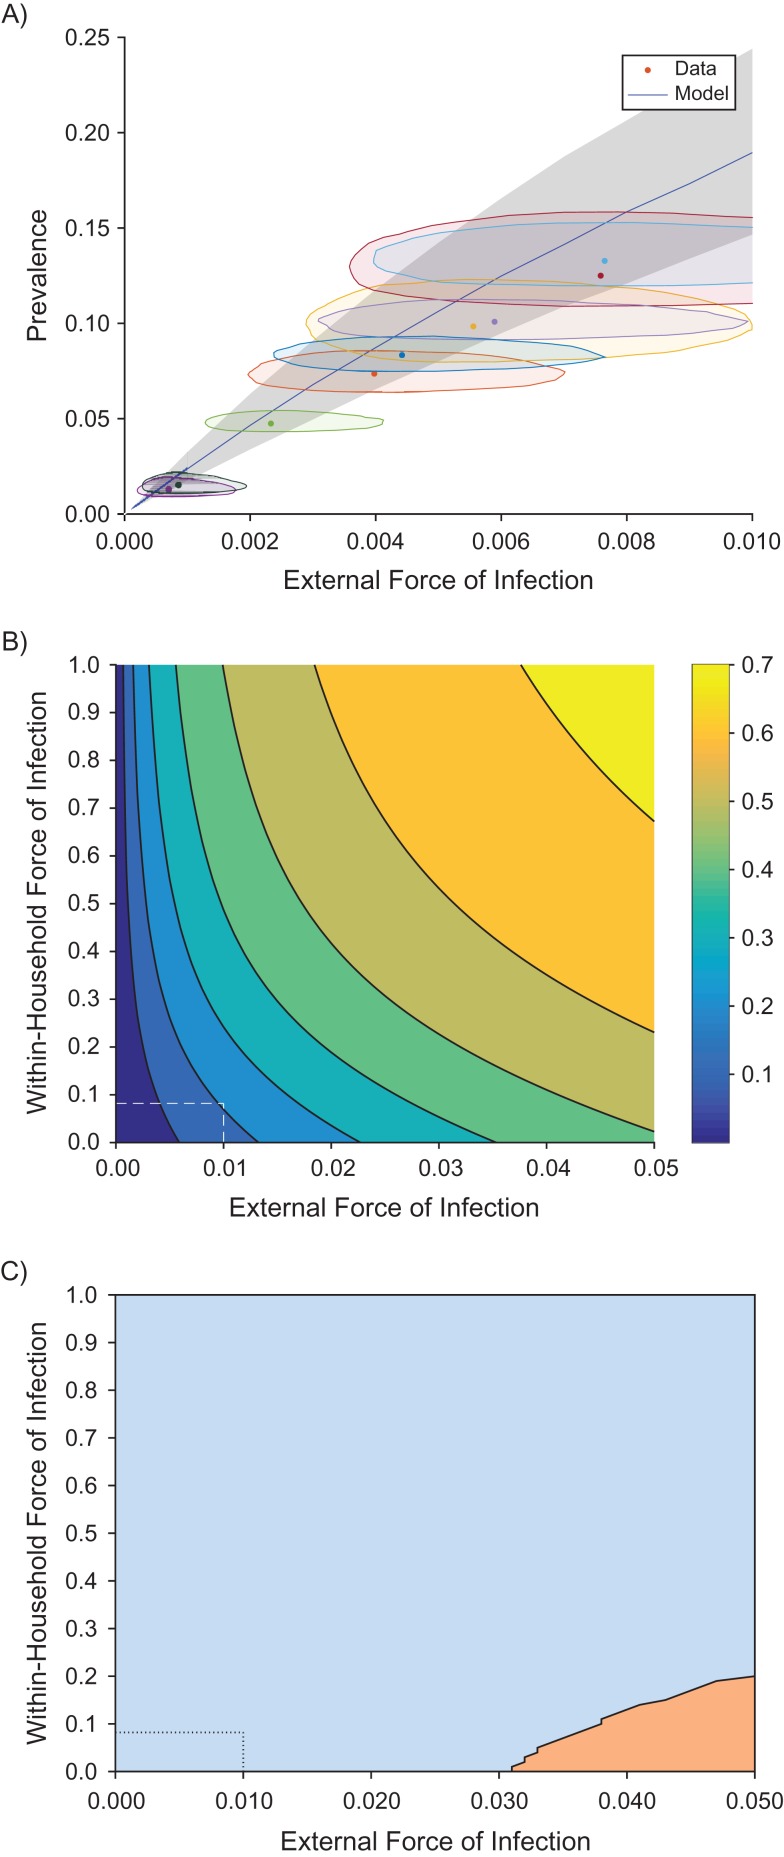
Figure 2.
Model predictions of the prevalence of infection (clinical and asymptomatic), comparing data to prevalence predictions. A) Model predictions using the fitted value of β (blue line) with parameter uncertainty (gray area), compared to data (dots with uncertainty regions) from the Solomon Islands, 2013. The shaded area around each point is the 95% credible area, representing combined uncertainty in the estimation of the external force of infection (ε) and the imputed prevalence values (see Web Appendix 1). B) Prevalence predictions for varying within-house (β) and external (ε) infection rates. The colors show increasing prevalences from blue to yellow (see color bar). C) The region in which increasing ε leads to a greater increase in prevalence than increasing β.

