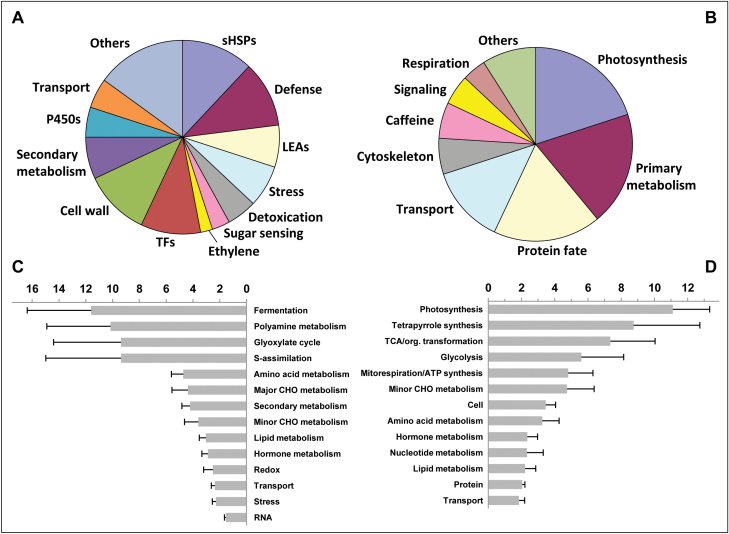
Fig. 2.
Functional analysis of genes differentially expressed during acquisition of desiccation tolerance (DT) in developing coffee seeds. Pie-charts of functions assigned to the top 100 up-regulated (A) and top 100 down-regulated (B) genes. Functional enrichment analysis (normalised frequencies of Mapman categories and bootstrap standard deviations) of the 1521 up-regulated (C) and the 677 down-regulated genes (D).

