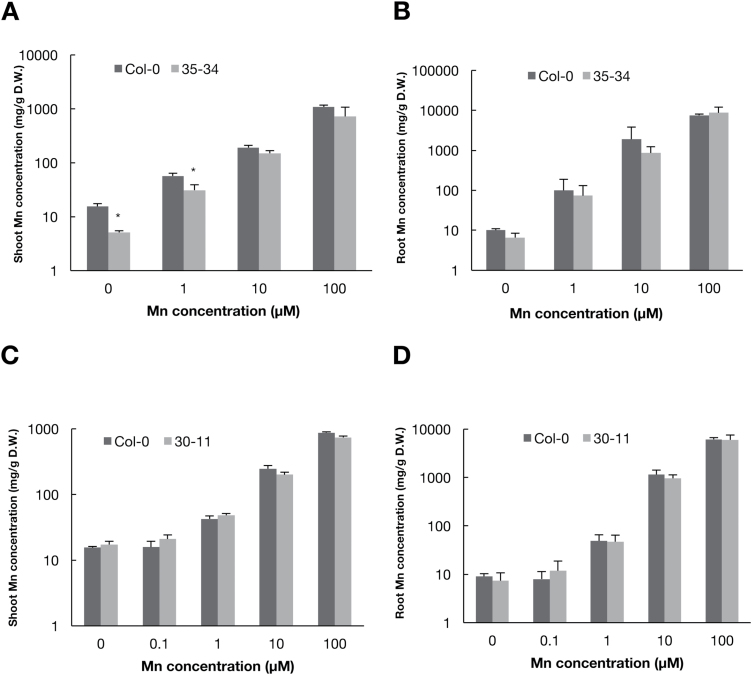
Fig. 2.
Mn concentrations of wild-type Col-0 and mutants 34–35 and 30-11. Plants were grown for 14 d under various concentrations of Mn. Mutant 35-34 was grown horizontally and mutant 30-11 was grown vertically. Mn concentrations in shoots and roots were determined using ICP-MS and are expressed as means (+SD). Mn concentrations in (A) shoots and (B) roots of mutant 34–35 (n=8). Mn concentrations in (C) shoots and (D) roots of mutant 30-11 (n=8–14). Asterisks indicate significant differences between Col-0 and the mutants as determined by Student’s t-test (*P<0.05).

