Fig. 3.
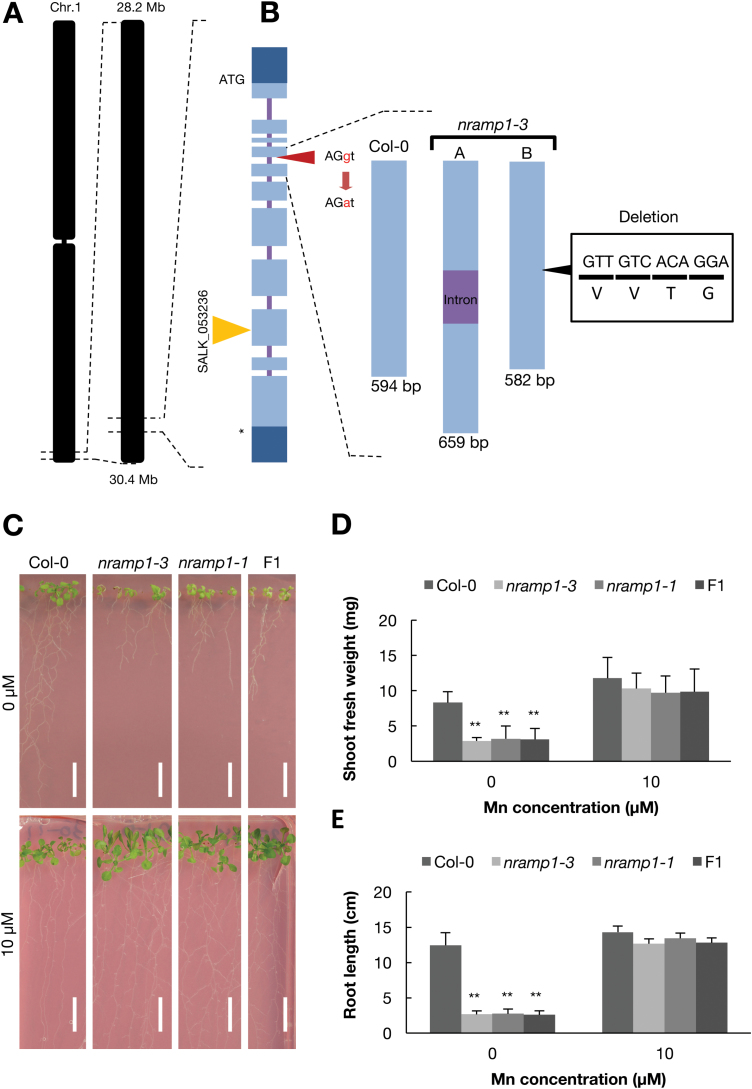
Identification of NRAMP1 as the causal gene. (A) Genetic mapping and the mutation site of nramp1-3, the exon–intron structures of the NRAMP1 gene, and the insertion site of T-DNA in SALK_053236 (nramp1-1). (B) A schematic diagram of the NRAMP1 gene in the wild-type and the splicing junction mutation in nramp1-3. Light blue boxes indicate exons encoding a protein, dark blue boxes are untranslated regions, and the bars between them are introns. ‘A’ represents the intron-inserted transcript and indicates the upper band shown in Supplementary Fig. S2A. ‘B’ represents the exon transcript that has a 12-bp deletion and indicates the bottom band in Supplementary Fig. S2A. (C) Phenotype of wild-type Col-0, nramp1-3, nramp1-1, and F1 plants between nramp1-3 and nramp1-1 under Mn deficiency and normal conditions. Plants were grown for 14 d. Scale bars indicate 1 cm. Fresh weight of shoots (D) and root length (E) of Col-0, nramp1-3, nramp1-1, and F1 plants. Data are means (+SD), n=6. Asterisks indicate significant differences between Col-0 and the mutants as determined by a Tukey–Kramer test (**P<0.01).

