
Fig. 1.
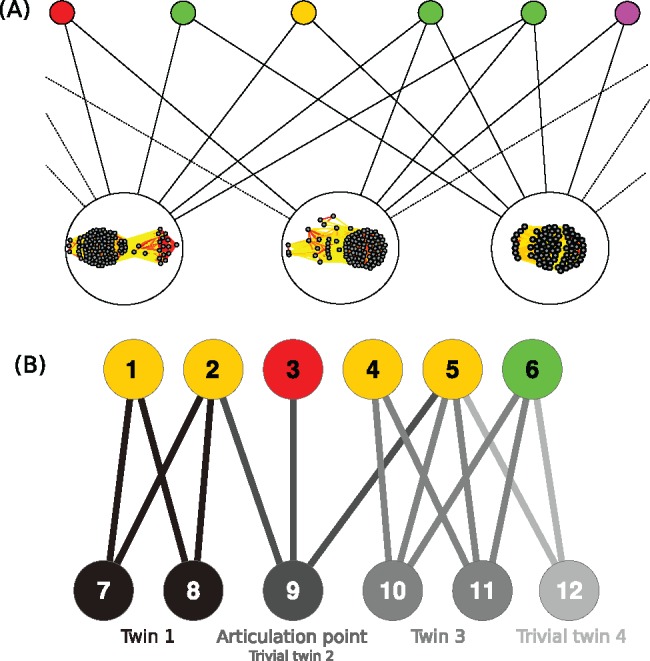
Construction of the bipartite graphs and identification of the twins and articulation points. (A) Construction of the genome-CHG bipartite graphs. Top nodes represent genomes of cells and mobile genetic elements. Bottom nodes represent CHG: we display the corresponding connected component of the sequence similarity network (see Materials and Methods), edge color (from yellow to red) indicates increasing % ID. (B) Bottom twins and articulation points: bottom nodes forming a twin class and their incident edges are drawn in the same shade of gray. Nodes 7 and 8 have the same neighbors (nodes 1 and 2) thus form twin class 1. Twins 2 and 4 are trivial since they contain only one node. Node 9 is an articulation point since its removal disconnects the graph.