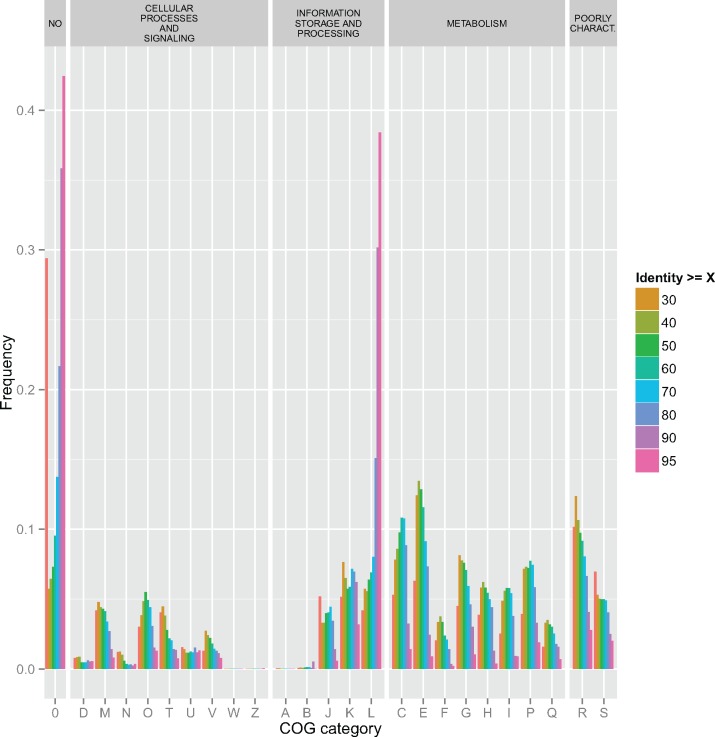
Fig. 5.
Distribution of functional categories among externalized genes. Color bars represent the percentage of a given COG category among externalized genes above a given identity threshold (according to the color code on the right side of the figure). On the upper bar, COG categories are grouped by large functional groups (including “Poorly characterized,” which includes COG categories R and S). The “No”/0 class (on the left) refers to the genes for which no COG category was attributed). Note the very conspicuous peak for the “L” category at thresholds ≥ 90% and 95% ID.

