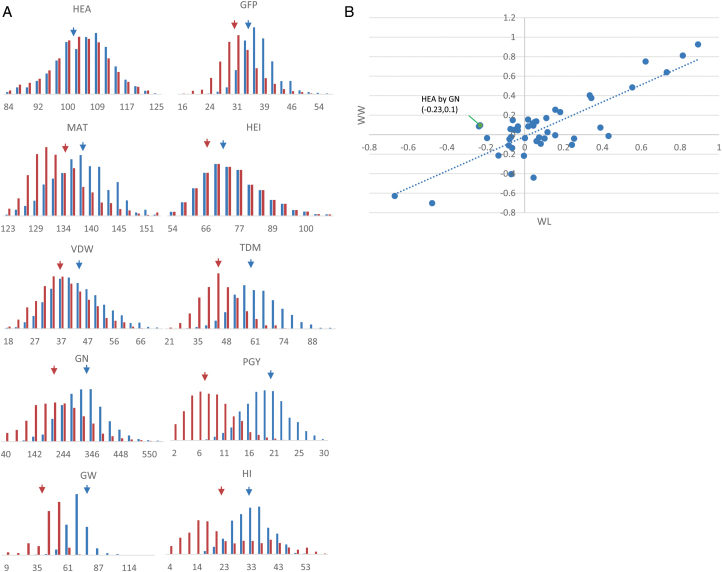
Fig. 1.
Distribution and correlation matrix of the measured traits under well-watered (WW) and water-limited (WL) conditions. (A) The distribution of the traits for the HEB-25 lines for WW (blue) and WL (orange) drought conditions (see detailed values in Supplementary Table S2). The blue and orange arrows indicate the mean values under WW and WL environments, respectively. (B) Scatter-plot of the pairwise correlations between the 10 traits under WL and WW. HEA, time to heading (days from sowing to anthesis); MAT, time to maturity (days from sowing to maturation); GFP, grain filling period (d); HEI, plant height (cm); VDW, vegetative dry matter per plant (g); TDM, total dry matter per plant (g); PGY, plant grain yield (g); GN, grain number per plant; GW, grain weight per plant (mg); HI, harvest index.

