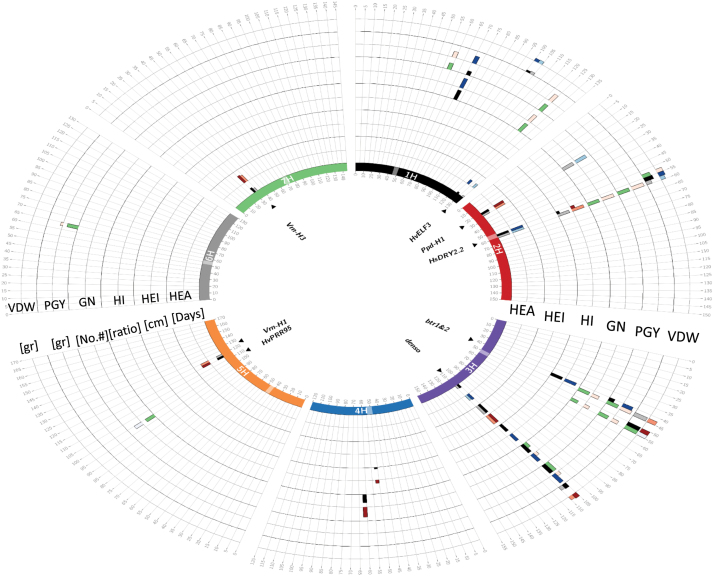
Fig. 2.
Circos plot depicting the GWAS results for traits per se (QTL) and interactions with environment (Q×E). Barley chromosomes in the plot are depicted in different colors in the inner-most circle and centromeres are indicated by the boxes radiating outwards. For each trait, the first (inner) track represents the QTL detection rate calculated across 200 repeated subsamples of 70% from the HEB-25 population in a 5-cM window, and the adjacent (outer) track represents the effect of this QTL. The maximum height of the effect bars is 10.03 d for HEA, 17.34cm for HEI, 24.3 for HI, 22.5 for GN, 22.44 g for PGY, and 23.04 gfor VDW. Window positions (in cM, as per Maurer et al. 2015) are ordered clockwise, per chromosome. In the inner track, QTLs appearing under WW and WL conditions are presented by black and gray bars, respectively. The QTLs showing significant Q×E interactions are represented by green bars. The effect of the QTL conferred by the wild allele relative to cultivated Barke is represented on the outer track, where blue and red bars indicate decreasing and increasing wild barley QTL effects, respectively, for each treatment. Genes potentially explaining the observed QTL effects are indicated inside the inner circle.

