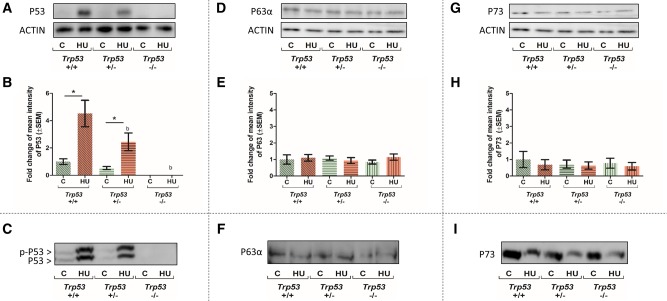
Figure 2.
Effects of HU treatment on P53, P63, and P73 protein expression and phosphorylation status in embryos. Top: Representative Western blots and quantification of P53 (A and B), P63 (D and E), and P73 (G and H) immunoreactivity, normalized to the loading control, actin, across all treatment groups, and Trp53 genotypes. Each bar represents the fold change of the mean quantity of the protein relative to actin. Bottom: Representative Phos-tag blots of P53 (C), P63 (F), P73 (I). Only P53 showed a higher molecular weight band, representing phosphorylated P53, p-P53. C, control; HU, hydroxyurea. P < .05, 2-way ANOVA followed by a Bonferroni post hoc test, n = 3. (*) denotes significant change compared with control group with the same genotype and (b) denotes significant change compared with the Trp53+/+ HU-treated group.

