Abstract
Background
Conventional phase I algorithms for finding a phase-2 recommended dose (P2RD) based on toxicity alone is problematic because the maximum tolerated dose (MTD) is not necessarily the optimal dose with the most desirable risk–benefit trade-off. Moreover, the increasingly common practice of treating an expansion cohort at a chosen MTD has undesirable consequences that may not be obvious.
Patients and methods
We review the phase I–II paradigm and the EffTox design, which utilizes both efficacy and toxicity to choose optimal doses for successive patient cohorts and find the optimal P2RD. We conduct a computer simulation study to compare the performance of the EffTox design with the traditional 3 + 3 design and the continuous reassessment method.
Results
By accounting for the risk–benefit trade-off, the EffTox phase I–II design overcomes the limitations of conventional toxicity-based phase I designs. Numerical simulations show that the EffTox design has higher probabilities of identifying the optimal dose and treats more patients at the optimal dose.
Conclusions
Phase I–II designs, such as the EffTox design, provide a coherent and efficient approach to finding the optimal P2RD by explicitly accounting for risk–benefit trade-offs underlying medical decisions.
Keywords: dose finding, phase I–II trials, risk–benefit tradeoff, adaptive design, immunotherapy, molecularly targeted agents
Key Message
The development of novel targeted or biologic agents makes conventional phase I methods of finding a maximum tolerated dose based on toxicity alone increasingly dysfunctional. We present the phase III design paradigm, which utilizes both efficacy and toxicity to choose an optimal dose, and show its scientific and ethical advantages compared with conventional phase I then phase II approach.
Introduction
The primary objective of a conventional phase I oncology trial is to establish a phase-II recommended dose (P2RD), which is commonly done by performing dose escalation up to the maximal tolerated dose (MTD) using adaptive designs such as 3 + 3 algorithms [1] and the continuous reassessment method (CRM) [2]. Most phase I trials are small, with very few patients treated at the MTD, often 6 or 9. To obtain more reliable toxicity estimates, and collect efficacy data, phase I trials often include ‘expansion cohorts’ that treat additional patients at the MTD. In the sequel, by ‘efficacy’ we mean a desirable clinical outcome, which may be a composite of several events that can be scored soon enough after dose administration for adaptive decision making to be done feasibly. This includes the special case of ‘activity’, such as >50% shrinkage of a solid tumor, engraftment of a stem cell transplant, or resolution of an infection. Here, ‘efficacy’ is not used to denote a long-term end point, such as overall survival or progress free survival, commonly used in phase III trials.
The traditional phase I paradigm of determining a P2RD based on toxicity with a small sample size, without using efficacy in the dose-finding algorithm, has some undesirable consequences. Denote the probabilities of efficacy and toxicity at dose d by pE(d) and pT(d). Suppose five doses of an agent, d = 1, 2, 3, 4, 5, have true toxicity probabilities (0.02, 0.04, 0.20, 0.30, 0.40). If the true efficacy probabilities are (0.20, 0.50, 0.51, 0.52, 0.52), then pE(d) increases to a plateau of 0.50 at d = 2, increasing very slightly for d = 3, 4, 5. The 3 + 3 algorithm, or CRM with target toxicity probability p* = 0.20, both are most likely to select d = 3 as the MTD/P2RD. But pE(2) = 0.50 and pE(3) = 0.51 are virtually identical, while d = 2 is much safer than d = 3 since pT(2) = 0.04 while pT(3) = 0.20, so d = 2 is preferable to d = 3. Any ‘toxicity only’ phase I method cannot determine this because it ignores efficacy. If the true efficacy probabilities are (0.20, 0.25, 0.30, 0.60, 0.65), escalating from d = 3 to d = 4 increases the toxicity probability from pT(3) = 0.20 to pT(4) = 0.30, but doubles the efficacy probability, from pE(3) = 0.30 to pE(4) = 0.60. This small increase in toxicity may be a reasonable trade-off for the large increase in efficacy by choosing d = 4 rather than d = 3, but toxicity-only methods cannot determine this. If the agent is ineffective for all doses, with true efficacy probabilities (0.00, 0.01, 0.01, 0.02, 0.02), the best decision is to not choose any dose, but toxicity-only methods still are most likely to choose d = 3. Thus, ignoring efficacy when choosing a ‘best’ dose for future study or clinical practice is a bad idea.
Adding an expansion cohort following phase I also has several logical, scientific and ethical flaws. It is based on the fallacious assumption that the MTD is known reliably to be the ‘best’ dose, ignoring the fact that any estimate from a small sample has large uncertainty. Supplementary Figure S1, available at Annals of Oncology online, shows 95% posterior credible intervals (CIs) for pT(MTD) in four cases, where [# toxicities]/[# patients treated] at the MTD are 1/6 (16%), 2/9 (22%), 2/12 (16%) or 3/15 (20%). The first 95% posterior CI says that, given one toxicity in six patients at the MTD, the probability is 0.95 that 0.007 < pT(MTD) < 0.52. Based on the 95% CIs, all four cases are consistent with pT(MTD) between 0.10 and 0.40.
In practice, treating an expansion cohort at a chosen MTD can be very problematic. Additional toxicity data easily may contradict the earlier conclusion that the selected dose is the MTD. What should one do if the first three patients in an expansion cohort of size 10 all have toxicity? The total of 1/6 + 3/3 = 4/9 (44%) toxicities at the MTD suggests that the MTD is unsafe. Should one treat seven more patients at the MTD, or violate the protocol by abandoning the MTD and de-escalating? If one de-escalates, what rules should be applied to choose a dose, or doses, for the seven patients? If one ends up with 7/10 toxicities in the expansion cohort, for 1/6 + 7/10 = 8/16 (50%) total, what should one conclude?
Recently, sizes of expansion cohorts have exploded, with hundreds in some protocols [9]. A large ‘phase I expansion cohort’ actually is a phase II trial, but conducted without any design, other than a specified sample size. This practice magnifies all of the above problems with a small expansion cohort. The MTD easily may turn out to be too toxic or ineffective. If no efficacy events are seen at the MTD in phase I or in the first 30 patients of a 100 patient expansion cohort, should 70 more patients be treated? If phase I is followed by a phase II trial with stopping rules for both toxicity and efficacy, and is stopped due to excessive toxicity at the MTD, then the agent must be abandoned, or a second dose-finding trial may be conducted to find a safe lower dose. How should data from the two previous trials be used when designing such a third trial?
Methods—phase I–II trial design
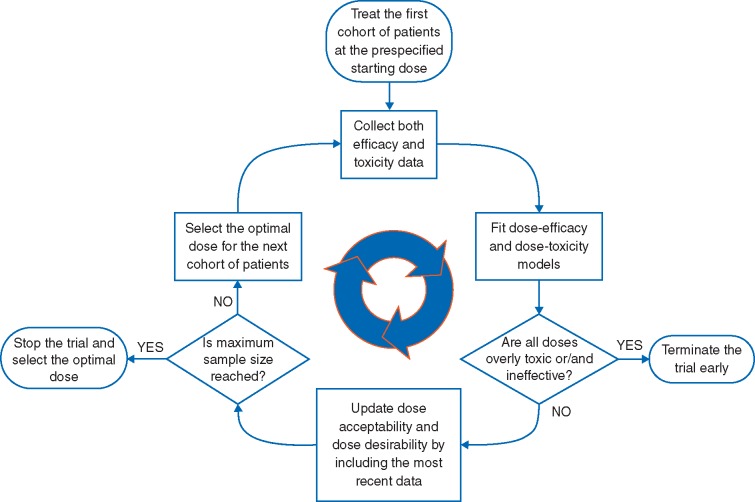
The above problems with conventional methods are avoided by phase I–II designs [3–5], which combine phase I and phase II into one trial. When a phase I–II trial is completed, no subsequent phase II trial is needed, since efficacy has been evaluated. The main components of a phase I–II design are summarized in Figure 1 and Box 1. A phase I–II design adaptively uses the (dose, efficacy, toxicity) data from all previous patients to make decisions and select the best dose for each new cohort. There is no ‘hard’ switch from toxicity-based phase I to cohort expansion or phase II.
Figure 1.
Diagram of phase I–II trial design. Based on the most recent data, the optimal dose is defined as the dose that maximizes the efficacy–toxicity trade-off.
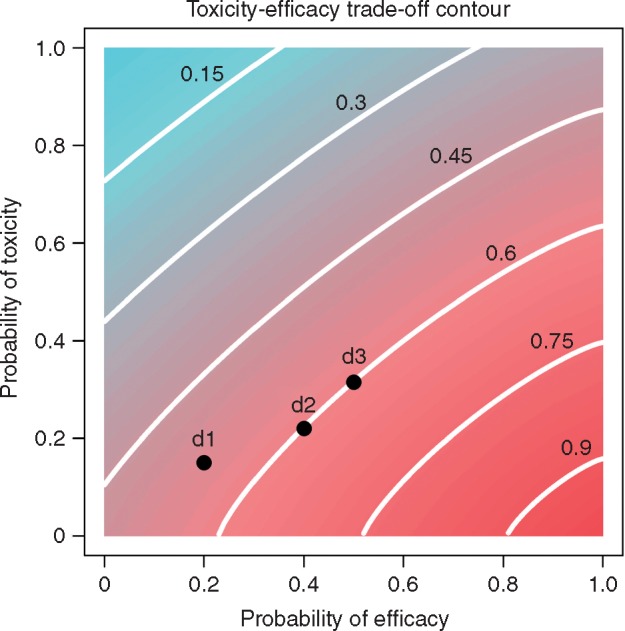
Using toxicity and efficacy gives phase I–II designs several important advantages. Compared with conventional phase I designs, phase I–II designs are more efficient, and reliably identify an optimal P2RD in terms of both safety and efficacy. Depending on the trial objectives, various strategies can be employed to choose doses [3]. One approach sets a fixed upper limit AT on pT(d) and defines the dose with pT(d) < AT that maximizes pE(d) to be optimal. Another approach uses an efficacy–toxicity trade-off to quantify each dose’s desirability, and thus choose the optimal dose. To illustrate phase I–II designs, we use the EffTox design [5, 6], which has been used to conduct several trials [7–9]. EffTox requires the investigator to specify a fixed AT and a fixed lower bound AE on pE(d), and uses an efficacy–toxicity trade-off contour as a criterion to choose each cohort’s optimal dose. A dose d is acceptable if, given the current data, there are reasonably high posterior probabilities that pE(d) > AE and pT(d) < AT. Values of AE and AT are determined by the clinical investigators, to reflect the particular definitions of efficacy and toxicity. Only acceptable doses are given to patients. If all doses are unacceptable the trial is stopped with no dose selected. Figure 2 gives the efficacy–toxicity trade-off contours for a particular EffTox design. All (pT, pE) pairs on each contour are equally desirable. The desirabilities of the contours increase moving from upper left to lower right, as pT becomes smaller and pE becomes larger. A procedure for constructing trade-off contours is given in supplementary Data, available at Annals of Oncology online. An alternative phase I–II design is based on elicited utilities of the four possible (efficacy, toxicity) outcomes [10–12].
Figure 2.

Toxicity–efficacy trade-off, where the lines indicate trade-off contours, and the numbers on the contours indicate the desirability of the contours. The desirability is standardized between 0 and 1, with the right bottom corner representing the most desirable case with desirability of 1, where efficacy is certain and toxicity is impossible, and the left upper corner representing the most undesirable case with desirability of 0, where efficacy is impossible and toxicity is certain. The dose ‘d2’ is more desirable than ‘d1’, and equally desirable as ‘d3’.
During the trial, to choose each cohort’s dose, the posterior means of pE(d) and pT(d) are computed for each acceptable d. The contour of this pair is determined, and the desirability of d is the desirability of the contour. The acceptable d with largest desirability is chosen for the next cohort. At the end of the trial, the dose with largest desirability is chosen as RP2D. Graphical user interface-based software for implementing EffTox is available at https://biostatistics.mdanderson.org/softwaredownload/.
By replacing separate phase I and II trials, a phase I–II trial can have a larger sample size than a conventional phase I trial. Using all (dose, efficacy, toxicity) data is much more informative than using only (dose, toxicity) data. If toxicity is too high or efficacy is too low for some d, the acceptability rules reduce the number of patients treated at d. If no dose is acceptable, the phase I–II design is likely to stop the trial early with no dose chosen.
In summary, advantages of phase I–II designs are that they (i) account explicitly for risk–benefit trade-offs between toxicity and efficacy; (ii) identify the optimal RP2D more reliably by using all (dose, efficacy, toxicity) data; (iii) avoid ad hoc dose modifications; and (iv) replace separate phase I and phase II trials with one trial.
Methods—illustrative trial
We illustrate EffTox using a trial conducted at the MD Anderson Cancer Center, using a disguised version for confidentiality. Five doses of lenalidomide were considered, 25, 50, 75, 100 and 125 mg/m2 (d = 1, 2, 3, 4, and 5), combined with a fixed dose of IV melphalan, as a preparative regimen for autologous stem cell transplant for myeloma. Toxicity was defined as regimen-related death, graft failure, or grade 3, 4 atrial fibrillation, deep venous thrombosis, or pulmonary embolism within 30 days post-transplant. Efficacy was defined as being alive and in complete remission at day 30. The fixed limits were AT = 0.30, AE = 0.20, the trade-off contours are illustrated in Figure 2, N = 30, cohort size 3, and no untried dose was skipped when escalating.
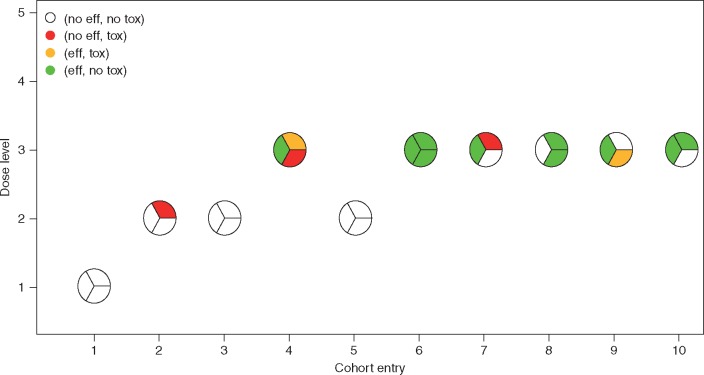
Figure 3 illustrates a trial using this design. The first cohort of three patients are treated at d = 1. None experience toxicity or efficacy, giving estimated desirabilities (0.50, 0.61, 0.71, 0.70, 0.66) for the five doses. Due to the do-not-skip rule, the design escalates to d = 2 for cohort 2, with one patient experiencing toxicity. The design chooses d = 2 for cohort 3, and no patients experience toxicity or efficacy. Based on the first 9 patients’ data, the updated desirabilities are (0.46, 0.46, 0.47, 0.45, 0.45). The design escalates to d = 3 for cohort 4, where one patient has efficacy, one has toxicity, and one has both. The updated desirabilities are (0.46, 0.48, 0.47, 0.44, 0.42) so the design de-escalates to d = 2 for cohort 5, and no patient experiences efficacy or toxicity. The design re-escalates to d = 3 for cohort 6, and all three patients experience efficacy without toxicity. Supplementary Figure S2, available at Annals of Oncology online, shows how the design adaptively adjusts its dose desirability estimates. After 10 cohorts at N = 30, d = 3 is the optimal P2RD, with estimated posterior mean toxicity probability 0.23, efficacy probability 0.63 and desirability 0.70. Totals of 3 patients were treated at d = 1, 9 patients at d = 2 and 18 patients at d = 3. If the 3 + 3 design were used instead, d = 2 would be selected as the MTD/P2RD, where 0 of 9 patients achieved efficacy.
Figure 3.
Illustration of trial conduct. Each circle represents a cohort of three patients, whose toxicity and efficacy outcomes are indicated by different colors. The EffTox design selects dose level 3 as the optimal dose. In contrast, the 3 + 3 design would select dose level 2 as the MTD, which shows little evidence of efficacy.
Methods—simulation study
We present a simulation study comparing EffTox with the 3 + 3 algorithm and CRM with target p* = 0.20, for a trial with five doses, maximum N = 30 or 60 patients, and cohort size 3. We included a modified CRM with cohort expansion (CRM-CE), using N/2 patients to find the MTD and N/2 as an expansion cohort. The CRM and CRM-CE include an early stopping rule if pT(d1) > 0.20 is likely. For the 3 + 3, after the MTD is selected, an expansion cohort is treated at the MTD, so the total sample size is N, for comparability. The EffTox design parameters are those in the myeloma trial, but with AT = 0.20 for comparability. Additional details are given in supplementary Data, available at Annals of Oncology online.
We considered four scenarios of true [pE(d), pT(d)], shown in supplementary Figure S3, available at Annals of Oncology online. In Scenario 1, pE(d) increases from d = 1 to a plateau at d = 2, which is optimal because pT(d) increases for d = 3, 4, 5. In Scenario 2, the pE(d) curve has an inverted U-shape with highest efficacy at d = 3, while pT(d) increases, so d = 3 is optimal with highest efficacy–toxicity trade-off. Scenario 3 is a case often observed with cytotoxic agents, and some targeted agents, where both pE(d) and pT(d) increase with dose, and d = 5 is optimal. In Scenario 4, all doses are inefficacious and pT(d) increases with d, so the best decision is to terminate the trial early. Each design was simulated 10 000 times under each scenario.
Results
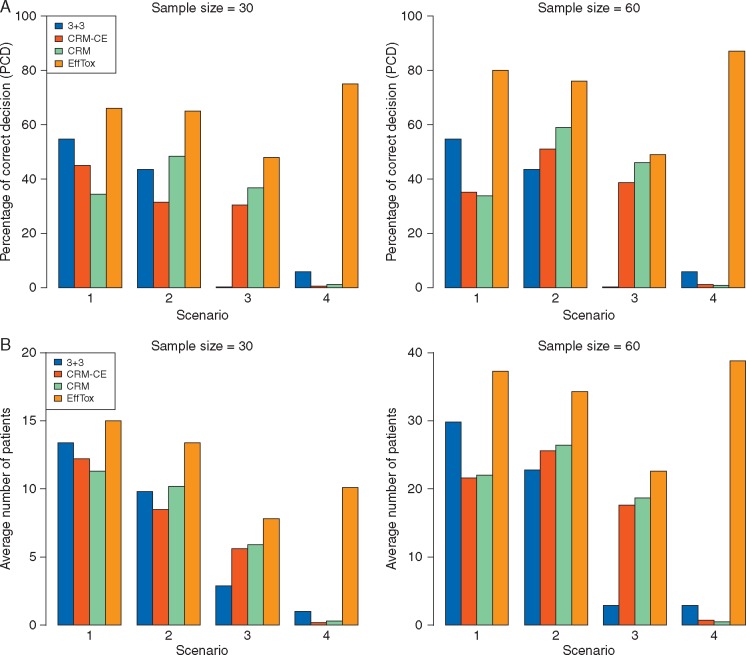
Simulation results are summarized in supplementary Tables S1 and S2, available at Annals of Oncology online. Figure 4A shows the percentage of correct decisions (PCDs), defined as the percentage of simulated trials where (i) the optimal dose is selected if it exists or (ii) no dose is selected if no dose is acceptable, for each design with N = 30 or 60. Overall, EffTox has the highest PCD. In Scenarios 1 and 2, the MTD is not optimal: in Scenario 1, d = 2 is optimal, but pT(3) is closest to 0.20; and in Scenario 2, d = 3 is optimal, but pT(4) is closest to 0.20. Therefore, although the CRM has highest probability of selecting the MTD, i.e. the dose with pT(d) closest to p* = 0.20, it performs poorly in finding the optimal dose in these two scenarios. When the dose with pT(d) closest to 0.20 is optimal, as in Scenario 3, the CRM performs well. In Scenario 4, where all doses are ineffective, the CRM and 3 + 3 both have very low PCD because they ignore efficacy, while EffTox correctly stops the trial and selects no dose with PCD= 0.77 for N = 30 and PCD = 0.87 for N = 60.
Figure 4.
Comparison of the 3 + 3 design with cohort expansion, CRM, CRM with cohort expansion and EffTox design. Higher values correspond to better performance. (A) Percentage of correct decisions. (B) Average number of patients treated at the optimal dose. In (B), under Scenario 4 where all doses have unacceptably low efficacy, the plotted value is the number of patients out of N that are not treated.
Figure 4B gives average numbers of patients treated at the optimal dose. In Scenario 4, since no dose is optimal, this is the number of patients not treated in the trial due to early termination. EffTox outperforms both the CRM and 3 + 3 design, with higher numbers of patients treated at the optimal dose. This suggests that EffTox is more ethical.
Discussion
Phase I–II trial designs provide a new paradigm for optimizing doses of new treatments. They explicitly reflect risk–benefit trade-offs, and avoid logical, scientific and ethical flaws of traditional phase I methods. Phase I–II designs reliably optimize dose in settings where the RP2D based on toxicity alone may have low efficacy or desirability.
One limitation of phase I–II design is that it assumes the same eligibility criteria throughout the trial. If eligibility criteria of phase I and phase II differ, then a phase I–II design cannot be used to replace the conventional approach. In addition, if efficacy takes a long time to evaluate, this may make adaptive decision making logistically difficult, although a phase I–II design for handling this issue exists [19] and has been used in three trials at M.D. Anderson Cancer Center. Phase I–II designs have been developed for more complicated settings, including trials with ordinal outcomes [13], three binary outcomes [14], time-to-event outcomes [15], jointly optimizing two-agent combinations [16, 17] or dose and schedule [10, 18], finding doses in two cycles [19] and optimizing subgroup-specific doses [12, 20].
Funding
National Social Science of China (No. 16BTJ021 to FY) and National Institutes of Health (R01 CA83932 to PFT and P50CA098258 to KHL and YY).
Disclosure
The authors have declared no conflicts of interest.
Box 1. Basic elements of a phase I–II design
Toxicity and efficacy outcomes that characterize potential risks and benefits of the treatment being studied
Risk–benefit trade-off criterion that characterizes and quantifies the trade-off between efficacy and toxicity for each dose
Statistical model describing the dose–toxicity and dose–efficacy relationships
Adaptive decision rule that determines the best dose for the next cohort, based on the (dose, toxicity, efficacy) data from all previous patients
Admissibility rules that protect patients in the trial from unacceptably toxic or inefficacious doses
Stopping rule that terminates the trial early if the all doses being considered are unacceptably toxic or inefficacious
Supplementary Material
References
- 1. Storer BE. Design and analysis of phase I clinical trials. Biometrics 1989; 45(3): 925–937. [PubMed] [Google Scholar]
- 2. O’Quigley J, Pepe M, Fisher L.. Continual reassessment method: a practical design for phase I clinical trials in cancer. Biometrics 1990; 46: 33–48. [PubMed] [Google Scholar]
- 3. Yuan Y, Nguyen H, Thall PF, Bayesian Designs for Phase I–II Clinical Trials. Boca Raton, FL, CRC Press, 2016. [Google Scholar]
- 4. Braun T. The bivariate continual reassessment method: extending the CRM to phase I trials of two competing outcomes. Contr Clin Trials 2002; 23(3): 240–256. [DOI] [PubMed] [Google Scholar]
- 5. Thall PF, Cook J.. Dose-finding based on toxicity-efficacy trade-offs. Biometrics 2004; 60(3): 684–693. [DOI] [PubMed] [Google Scholar]
- 6. Thall PF, Herrick R, Nguyen H. et al. Effective sample size for computing prior hyperparameters in Bayesian phase I–II dose-finding. Clin Trials 2014; 11(6): 657–666. [DOI] [PMC free article] [PubMed] [Google Scholar]
- 7. deLima M, Champlin RE, Thall PF. et al. Phase I/II study of gemtuzumab ozogamicin added to fludarabine, melphalan and allogeneic hematopoietic stem cell transplantation for high-risk CD33 positive myeloid leukemias and myelodysplastic syndrome. Leukemia 2008; 22: 258–264. [DOI] [PubMed] [Google Scholar]
- 8. Whelan HT, Cook JD, Amlie-Lefond CM. et al. Practical model-based dose-finding in early phase clinical trials: Optimizing tissue plasminogen activator dose for treatment of ischemic stroke in children. Stroke 2008; 39(9): 2627–2636. [DOI] [PubMed] [Google Scholar]
- 9. Konopleva M, Thall PF, Yi CA. et al. Phase I/II Study of PR104, hypoxia-activated pro-drug in refractory/relapsed acute myeloid leukemia and acute lymphoblastic leukemia. Haematologica 2015; 100(7): 375–385. [DOI] [PMC free article] [PubMed] [Google Scholar]
- 10. Thall PF, Nguyen HQ, Braun TM. et al. Using joint utilities of the times to response and toxicity to adaptively optimize schedule-dose regimes. Biometrics 2013; 69(3): 673–682. [DOI] [PMC free article] [PubMed] [Google Scholar]
- 11. Houede N, Thall PF, Nguyen H. et al. Utility-based optimization of combination therapy using ordinal toxicity and efficacy in phase I/II trials. Biometrics 2010; 66(2): 532–540. [DOI] [PMC free article] [PubMed] [Google Scholar]
- 12. Guo B, Yuan Y.. Bayesian phase I/II biomarker-based dose finding for precision medicine with molecularly targeted agents. J Am Stat Assoc 2017; 112(518): 208–220. [DOI] [PMC free article] [PubMed] [Google Scholar]
- 13. Jin I, Liu S, Thall P. et al. Using data augmentation to facilitate conduct of phase I/II clinical trials with delayed outcomes. J Am Stat Assoc 2014; 109(506): 525–536. [DOI] [PMC free article] [PubMed] [Google Scholar]
- 14. Thall PF, Nguyen HQ, Zohar S. et al. Optimizing sedative dose in preterm infants undergoing treatment for respiratory distress syndrome. J Am Stat Assoc 2014; 109(507): 931–943. [DOI] [PMC free article] [PubMed] [Google Scholar]
- 15. Yuan Y, Yin G.. Bayesian dose-finding by jointly modeling toxicity and efficacy as time-to-event outcomes. J R Stat Soc Ser C Appl Stat 2009; 58(5): 719–736. [Google Scholar]
- 16. Mandrekar S, Cui Y, Sargent D.. An adaptive phase I design for identifying a biologically optimal dose for dual agent drug combinations. Stat Med 2007; 26(11): 2317–2330. [DOI] [PubMed] [Google Scholar]
- 17. Yuan Y, Yin G.. Bayesian phase I/II drug-combination trial design in oncology. Ann Appl Stat 2011; 5(2A): 924–942. [DOI] [PMC free article] [PubMed] [Google Scholar]
- 18. Guo B, Li Y, Yuan Y.. A dose-schedule-finding design for phase I/II clinical trials. J R Stat Soc Ser C Appl Stat 2016; 65(2): 259–272. [DOI] [PMC free article] [PubMed] [Google Scholar]
- 19. Lee J, Thall PF, Ji Y. et al. Bayesian dose-finding in two treatment cycles based on the joint utility of efficacy and toxicity. J Am Stat Assoc 2015; 110(510): 711–722. [DOI] [PMC free article] [PubMed] [Google Scholar]
- 20. Thall PF, Nguyen H, Estey E.. Patient-specific dose finding based on bivariate outcomes and covariates. Biometrics 2008; 64(4): 1126–1136. [DOI] [PubMed] [Google Scholar]
Associated Data
This section collects any data citations, data availability statements, or supplementary materials included in this article.


