Figure 2.
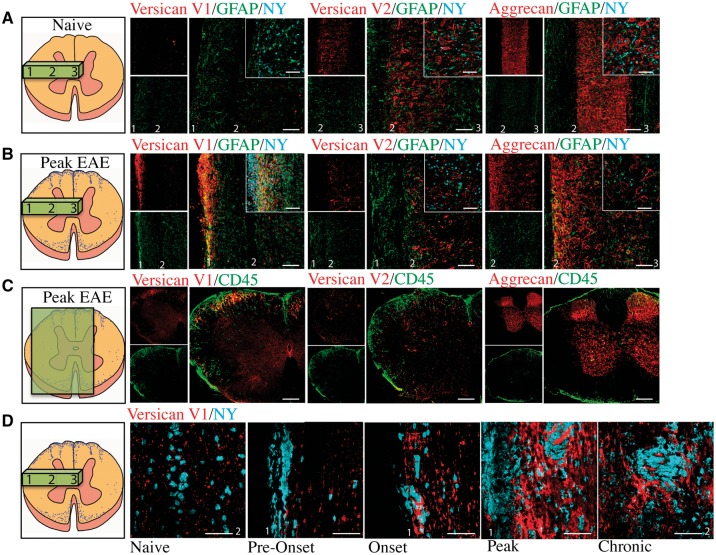
Versican V1 expression is upregulated at peak EAE correspondent with regions of inflammation. Longitudinal sections of versican V1, versican V2, and aggrecan (red) co-stained with GFAP (green) and nuclear yellow (NY, blue) in (A) naïve mice and (B) EAE mice at peak disease severity; we used GFAP as an indicator of the response of CNS-intrinsic cells during EAE. (C) Versican V1, versican V2, and aggrecan (red) staining shows that V1 was correspondent with CD45+ (green) cells in coronal spinal cord sections from EAE mice; conversely, V2 and aggrecan were not upregulated in regions of inflammation. (D) Versican V1 (red) staining in the mouse EAE thoracic spinal cord at naïve (non-immunized), pre-onset, onset, peak, and chronic time points co-stained with nuclear yellow (NY, blue) as a nuclear marker. Spinal cord schematics on the far left show the slice orientation, and numbers that correspond to pial region (1), grey matter boundary (2) and centre of the spinal cord (3), that are labelled in the immunohistochemistry images. Insets show higher magnification. Scale bars = 50 μm.

