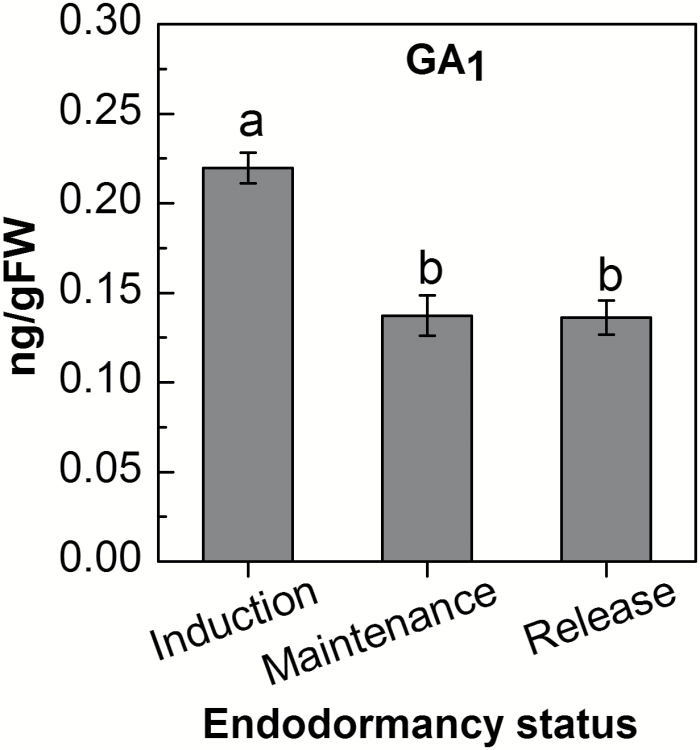
Fig. 2.
Quantities of endogenous GA1 in grapevine buds throughout the dormancy cycle. Buds were sampled weekly from the vineyard and were frozen immediately as described in Fig. 1. Buds were homogenized, and GA1 was quantified by LC–MS/MS (Acheampong et al., 2015). 2H-labeled GA1 was spiked as internal standard. The levels of GA1 were calculated from the peak area ratios of the endogenous GA1 to its 2H-labeled internal standard. Three biological replications (10 buds per replicate) were analyzed for each time point, and means from three time points during endodormancy induction, maintenance, and release (1–13 November, 20 November–18 December, and 25 December–8 January, respectively) served to calculate GA1 levels. Data points with different letters indicate significantly different values (P<0.05) according to Tukey’s HSD test.

