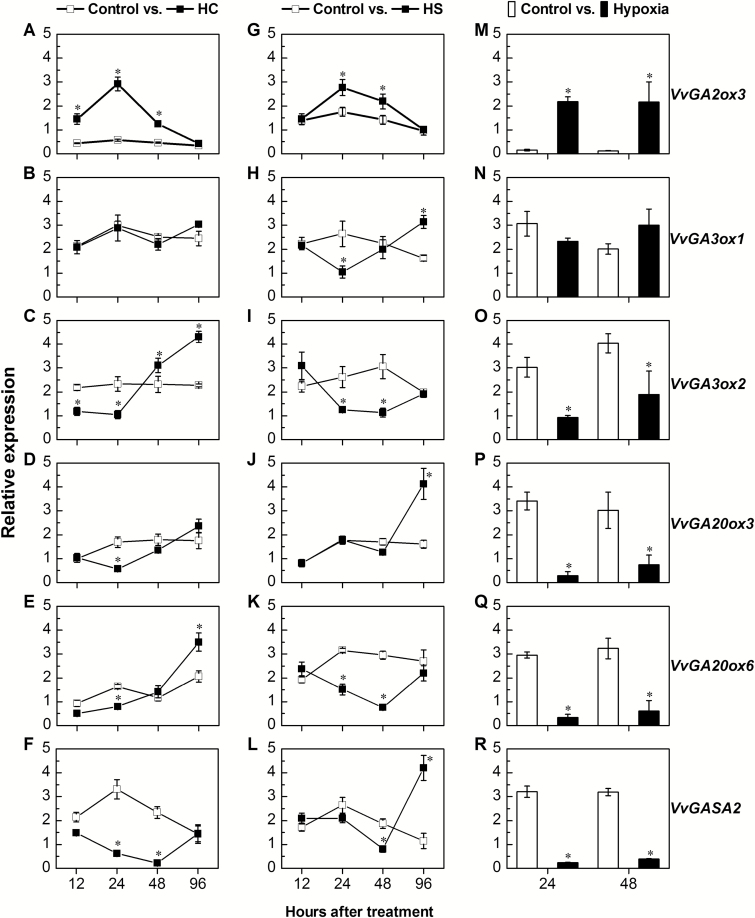
Fig. 6.
The effect of artificial stimuli of dormancy release on the expression profile of central components of GA metabolism and the GA-responsive VvGASA2 gene. Total RNA was extracted from control- (0.02% Triton X-100), HC- (3% Dormex® with 0.02% Triton X-100), and HS- (50 °C water for 1 h) treated buds sampled at 12, 24, 48, and 96 h after treatment, and from hypoxia- (1% O2) treated buds at 48 h and 96 h after treatment. Relative expression of VvGA2ox3 (A, G, and M), VvGA3ox1 (B, H, and N), VvGA3ox2 (C, I, and O), VvGA20ox3 (D, J, and P), VvGA20ox6 (E, K, and Q), and VvGASA2 (F, L, and R) was determined by qRT-PCR in HC- (A–F), HS- (G–L), and hypoxia- (M–R) treated buds, as described in the Materials and methods, and normalized against VvActin and VvGAPDH. Values represent the mean expression ±SE of three biological replications, each with two technical repeats. Asterisks between treatments indicate significant differences according to Student’s t-test (*P<0.05).

