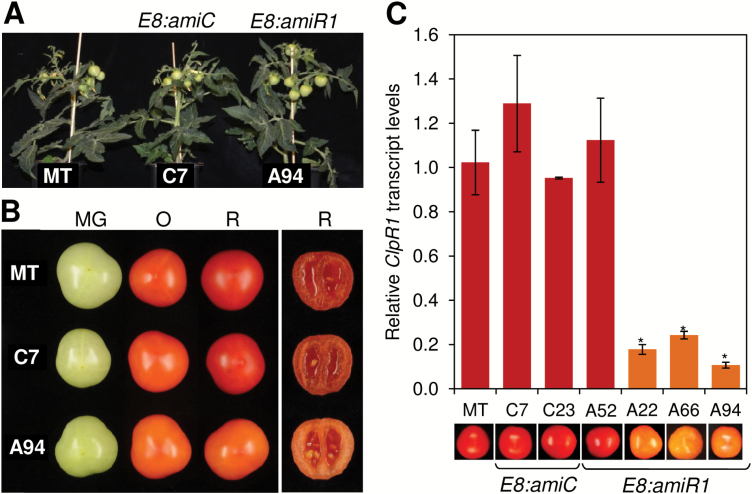
Fig. 3.
Reduced ClpR1 transcript levels result in orange ripe fruits. (A) Representative greenhouse-grown plants either untransformed (MT) or transformed with E8:amiC (line C7) or E8:amiR1 (line A94) constructs. Transgenic plants of the T2 generation are shown. (B) Representative fruits of the indicated lines at three developmental stages (MG, O, and R). (C) qPCR analysis of ClpR1 transcript levels in ripe fruits from MT plants or T2 generation E8:amiC (C7 and C23) and E8:amiR1 (A52, A22, A66, and A94) transgenic lines. Values are shown relative to those in MT fruit and correspond to the mean ±SE (n ≥3). Asterisks mark statistically significant differences relative to MT samples (P<0.05). Representative fruits of every line at the R stage are also shown.

