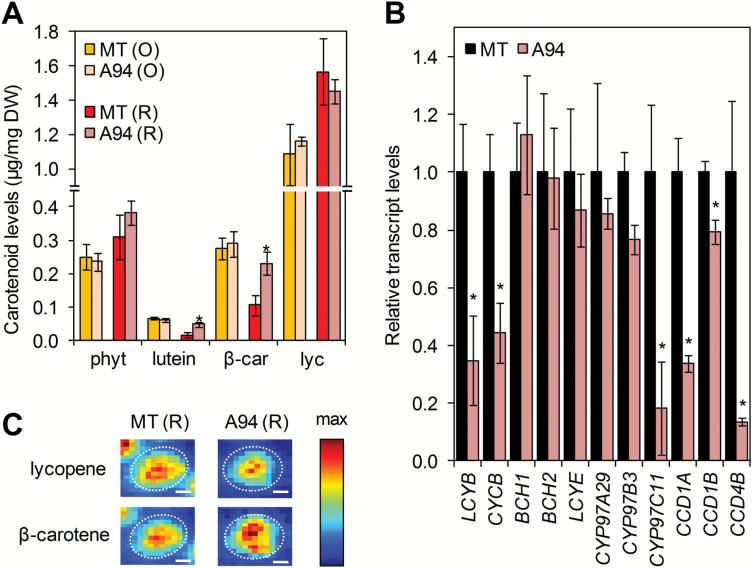
Fig. 4.
ClpR1-silenced fruits are enriched in β-carotene. (A) Levels of individual carotenoids in fruits of the indicated lines at O and R stages (phyt, phytoene; β-car, β-carotene; lyc, lycopene). Data correspond to the mean ±SE of n=3 independent fruit. (B) qPCR analysis of the levels of transcripts from the indicated genes in ripe MT and A94 fruits. See Fig. 1 and Supplementary Table 1Supplementary Table S1 for accessions. Means ±SE of n ≥5 fruits are shown relative to MT samples. Asterisks mark statistically significant differences relative to reference MT samples (P<0.05). (C) Raman imaging of lycopene and β-carotene accumulation in individual plastids from ripe MT and A94 fruits. Chromoplast perimeters are indicated with dashed white lines. Colors represent the MCR scores (i.e. relative abundance) of the corresponding pure components according to the scale shown in the box. Scale bars correspond to 2 µm.

