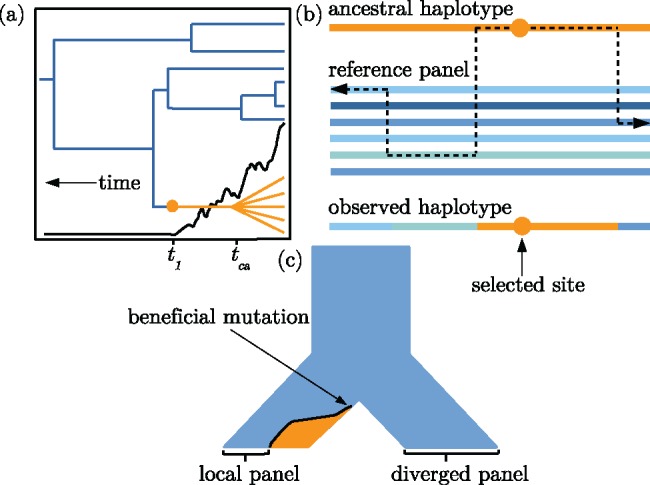
Fig. 1.

Visual descriptions of the model. (a) An idealized illustration of the effect of a selectively favored mutation’s frequency trajectory (black line) on the shape of a genealogy at the selected locus. The orange lineages are chromosomes with the selected allele. The blue lineages indicate chromosomes that do not have the selected allele. Note the distinction between the time to the common ancestor of chromosomes with the selected allele, tca, and the time at which the mutation arose, t1. (b) The copying model follows the ancestral haplotype (orange) moving away from the selected site until recombination events within the reference panel lead to a mosaic of nonselected haplotypes surrounding the ancestral haplotype. (c) A demographic history with two choices for the reference panel: Local and diverged. After the ancestral population at the top of the figure splits into two sister populations, a beneficial mutation arises and begins increasing in frequency. The orange and blue colors indicate frequency of the selected and nonselected alleles, respectively.
