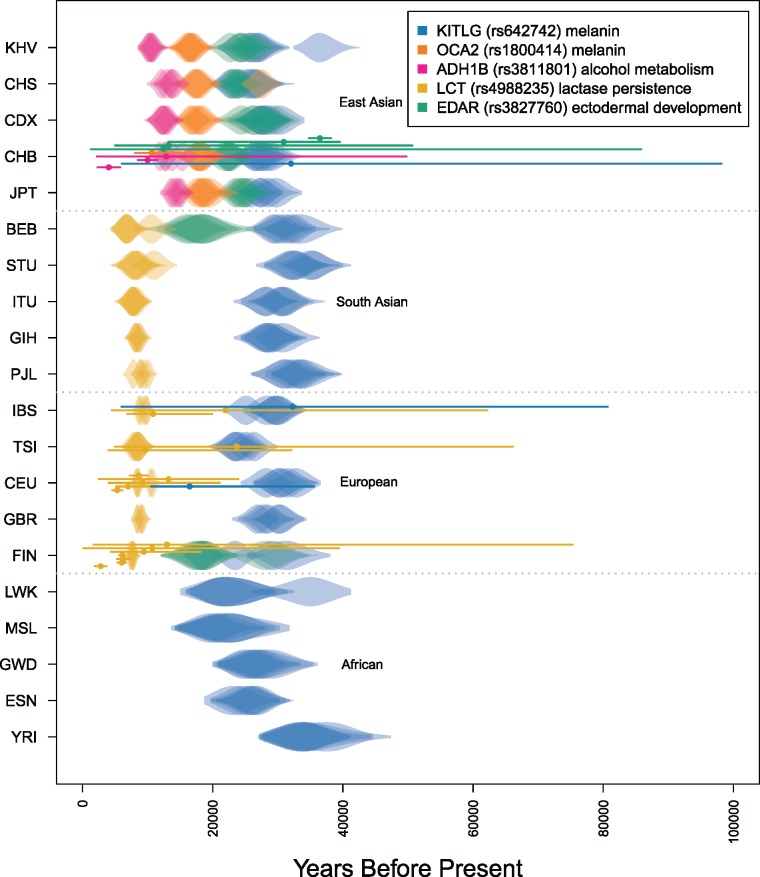
Fig. 3.
Comparison of TMRCA estimates with previous results. Violin plots of posterior distributions for the complete set of estimated TMRCA values for the five variants indicated in the legend scaled to a generation time of 29 years. Each row indicates a population sample from the 1000 Genomes Project panel. Replicate MCMCs are plotted with transparency. Points and lines overlaying the violins are previous point estimates and 95% confidence intervals for each of the variants indicated by a color and rs number in the legend (see supplementary tables 3 and 4, Supplementary Material online). The population sample abbreviations are defined in text.

