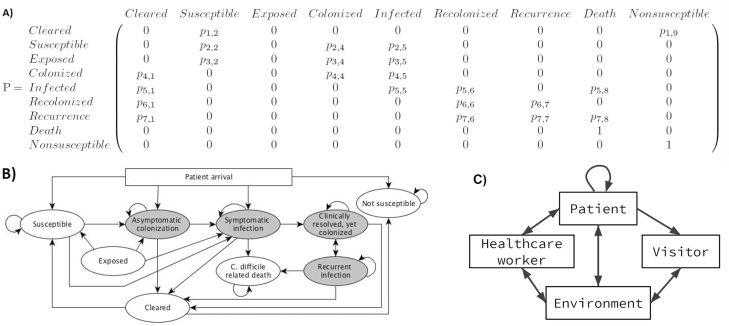
Figure 1.
Matrix (A) and transition state (B) diagram representations of the discrete-time Markov chain underlying transitions between clinical states. The gray ovals represent clinical states from which C. difficile can be transmitted, while the white ovals are the noninfective states. Patient clinical states are updated every 6 hours. C, There are 10 agent:agent or agent:environmental interactions that can lead to a C. difficile transmission event. Abbreviation: C.difficile, Clostridium difficile

