Figure 1.
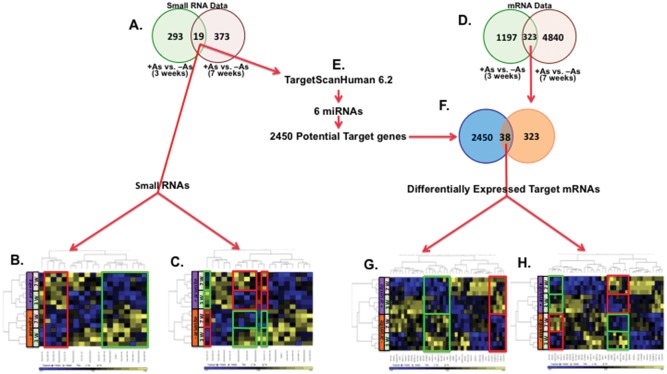
Exposure and time-dependent differential expression of small RNAs and mRNAs detected by hybridization microarrays. A, Venn diagrams of differentially expressed small RNAs at both 3 and 7 weeks (p < .05). Unsupervised hierarchical clustering of the 19 small RNAs differentially expressed at both 3 and 7 weeks of exposure to arsenite. B, Arsenite exposure-dependent induced (red boxed) and suppressed (green boxed) small RNAs. C, Time-dependent differentially expressed miRNAs and the expression pattern is flipped by arsenite exposure compared with nonexposed cells, induced (red boxed) and suppressed (green boxed). D, Venn diagram of differentially expressed mRNAs at 3 and 7 weeks. E, Predicted mRNA targets of 6 differentially expressed miRNAs were found in TargetScan Human V6.2 database. F, Venn diagram of intersection of predicted mRNA targets of differentially expressed miRNAs and differentially expressed 323 mRNAs at both 3 and 7 weeks. Unsupervised hierarchical clustering of the 39 mRNAs differentially expressed at both 3 and 7 weeks of exposure to arsenite that are predicted targets of 6 miRNAs differentially expressed at both 3 and 7 weeks. G, Arsenite exposure-dependent induced (red boxed) and suppressed (green boxed) mRNAs. H, Time-dependent differentially expressed mRNAs and the expression pattern is flipped by arsenite exposure compared with nonexposed cells, induced (red boxed) and suppressed (green boxed). Analysis was done using Partek Genomic Suite.

