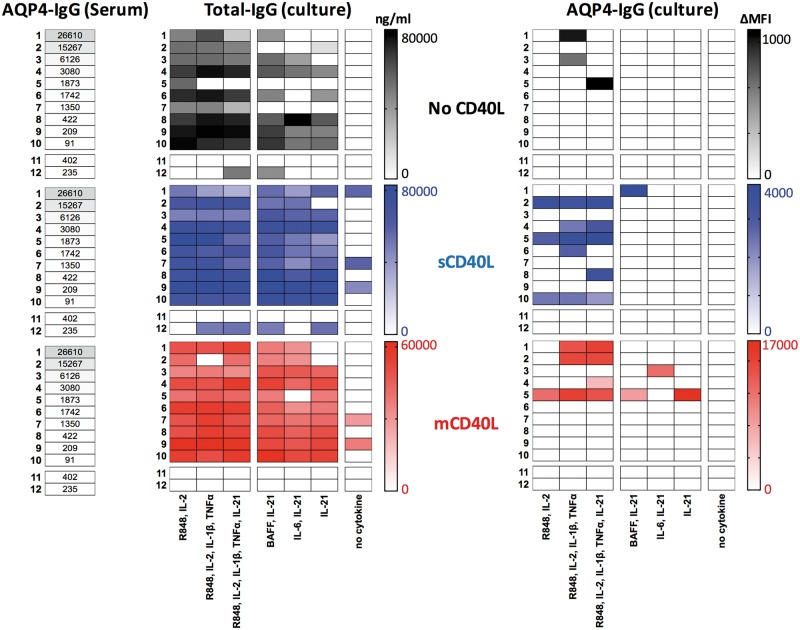
Figure 4.
Relationships between serum AQP4-IgG (ΔMFI), and the in vitro generation of total-IgG (ng/ml) and AQP4-specific IgG (ΔMFI) across culture conditions. Heat-map generated from data on 12 patients (rows 1–12, corresponding to Table 1) across seven culture conditions. The first three culture conditions include R848 and IL-2 ± TNFα, IL-1β and IL-21, the next three include IL-21 ± BAFF or IL-6, and the seventh has no cytokines. Black = no CD40L; blue = with soluble CD40L (sCD40L); red = with membrane-bound CD40L (mCD40L). Grey bars with values in cells indicate serum AQP4-IgG levels (ΔMFI). Gamma-corrected values depicted, with absolute values shown in Supplementary Fig. 3. Patients are ordered by serum AQP4-IgG levels; Patients 11 and 12 received rituximab.

