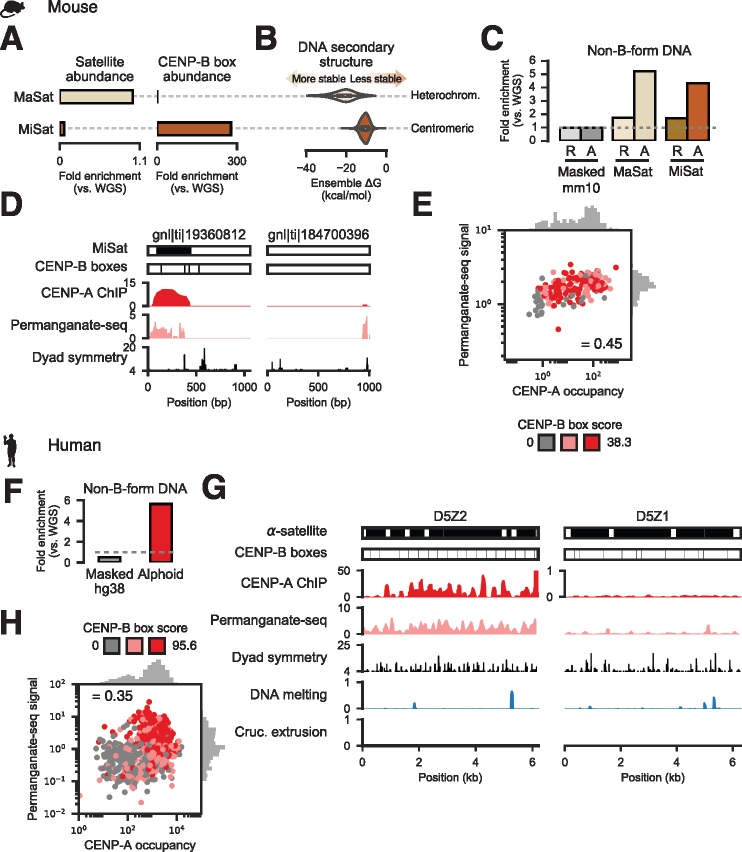
Fig. 3.
Non-B-form DNA detected experimentally at dyad-depleted functional human and mouse centromeres. (A) Abundance of heterochromatic major (MaSat) and centromeric minor (MiSat) satellite fragments (left) and the minimal CENP-B box (right) in mouse WGS reads. (B) DNA secondary structure free energy distributions from computational prediction for MaSat and MiSat-containing Sanger reads. (C) Fraction of permanganate-seq reads from resting (R) and LPS-activated (A) cells mapping to the masked mouse genome (Masked mm10) or Sanger reads containing MiSat or MaSat monomers. (D) Examples of Sanger reads harboring MiSat and CENP-B box sequences (left) or devoid of predicted centromeric features (right) and signal from CENP-A ChIP-seq, permanganate-seq, and dyad symmetry analysis. (E) Correlation between total permanganate-seq signal from activated B cells (normalized to control) and input-normalized CENP-A occupancy for MiSat-containing Sanger reads. Scatter plot points are colored based on CENP-B box score tertile, where scores are defined as the sum of scores for all FIMO-defined CENP-B boxes occurring on a read. (F) Fraction of permanganate-seq reads aligning to the repeat-masked hg38 assembly and HuRef Sanger alphoid reads normalized to number of reads from WGS of HuRef mapping to the respective assemblies. (G) Examples of permanganate-seq, CENP-A ChIP, dyad symmetry, and predicted DNA melting and cruciform transition probabilities for functionally active (D5Z2) and inactive (D5Z1) α-satellite repeat arrays. Note that the CENP-A ChIP tracks are on different scales. (H) Correlation between total permanganate-seq signal and CENP-A occupancy for alphoid Sanger reads. Scatter plot points are colored based on CENP-B box score tertile.

