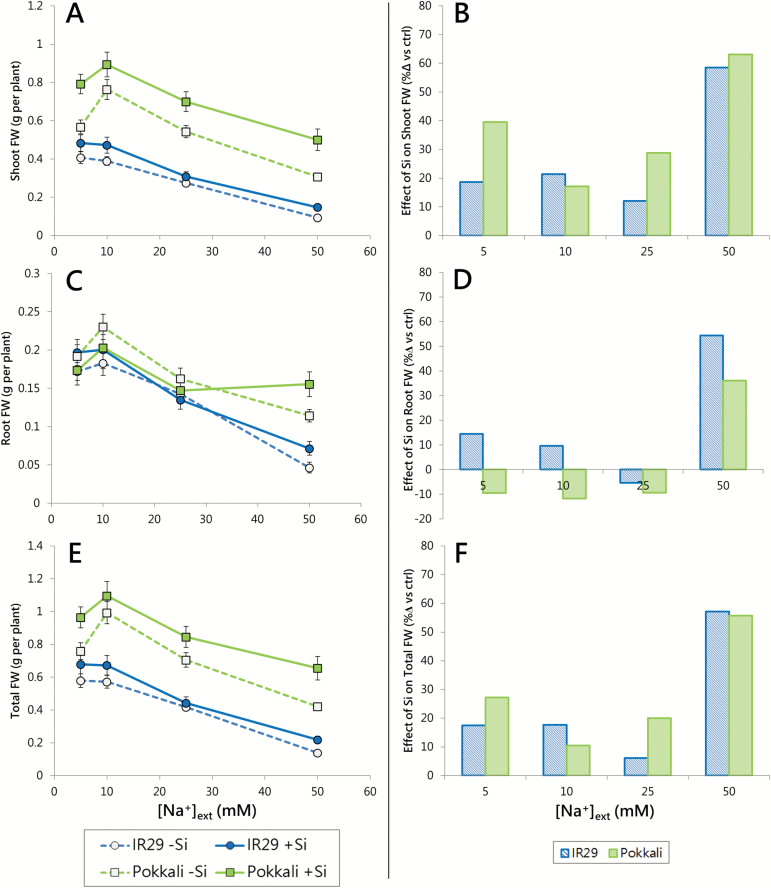
Fig. 1.
Fresh weight of 21-day-old seedlings of IR29 (circles) and Pokkali (squares), in response to NaCl (5–50 mM) and Si (0 or 1.67 mM) treatments, imposed when seedlings were 2 d old. (A, C, E) Shoot, root, and total FW. (B, D, F) Percentage increases in shoot, root, and total FW in Si-treated plants, relative to controls. FW data are represented as the mean ±SEM (n=11–12). Dotted lines and open symbols, 0 mM Si; solid lines and filled symbols, 1.67 mM Si. Measurements taken at 30 °C in seedlings grown under a 30/20 °C (day/night) temperature cycle. Statistical analysis of these data can be found in Supplementary Table S1, and corresponding dry weight data in Supplementary Fig. S1.

