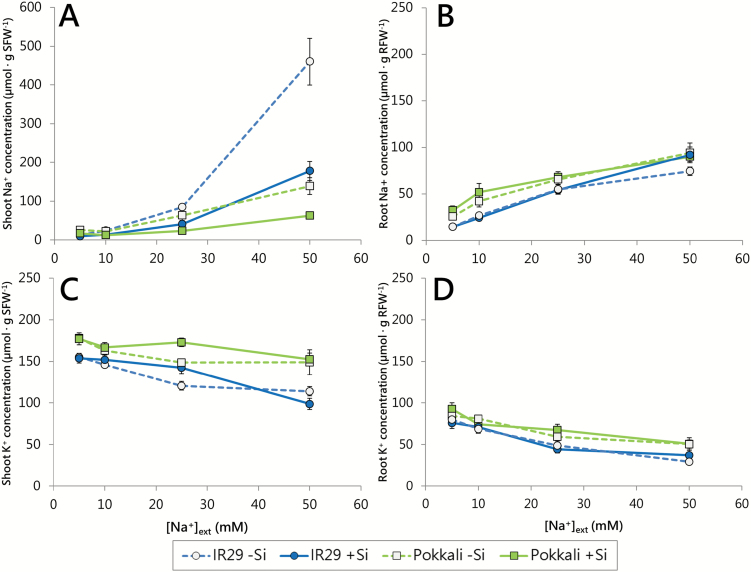
Fig. 2.
Na+ (A, B) and K+ (C, D) concentrations in shoots (A, C) and roots (B, D) of 21-day-old seedlings of IR29 (circles) and Pokkali (squares), in response to NaCl (5–50 mM) and Si (0 or 1.67 mM). Data are normalized per gram of organ FW and are represented as the mean ±SEM (n=11–12). Dotted lines and open symbols, 0 mM Si; solid lines and filled symbols, 1.67 mM Si. Measurements taken at 30 °C in seedlings grown under a 30/20 °C (day/night) temperature cycle. For FW:DW ratios, see Supplementary Fig. S3.

