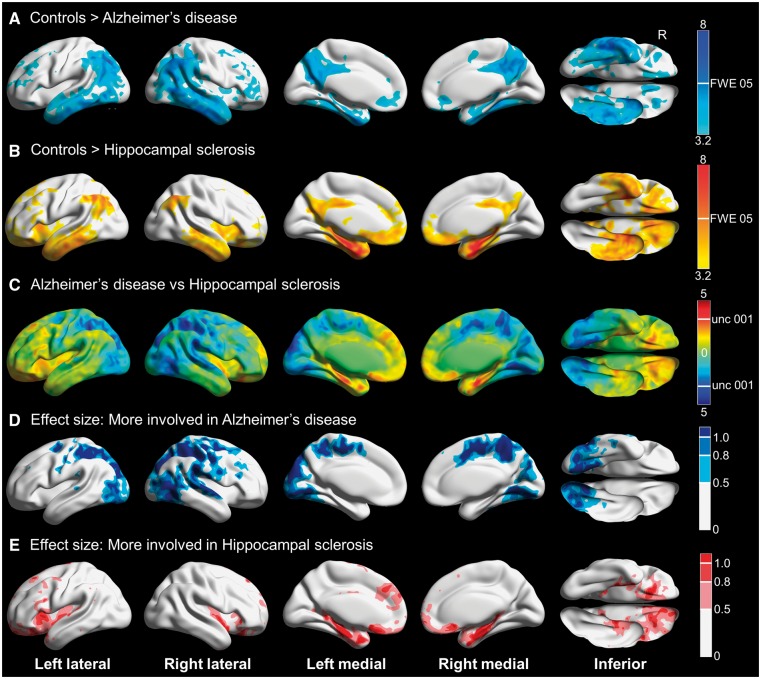
Figure 3.
3D brain renderings showing results of FDG-PET analysis in hippocampal sclerosis and Alzheimer’s disease participants. (A) Compared to controls, TDP-43 negative Alzheimer’s disease was associated with hypometabolism of the posterior cingulate, middle and inferior temporal and lateral and medial parietal regions including the precuneus. There was minimal medial temporal involvement. Results are shown at P(unc) = 0.001 with the height cut-off for FWE correction shown in the colour bar. (B) Compared to controls, TDP-43-positive hippocampal sclerosis was associated with hypometabolism predominantly in the medial temporal lobe, with additional involvement of the middle and inferior temporal, lateral parietal and insular regions. Results are shown at P(unc) = 0.001 with the height cut-off for family-wise error (FWE) correction shown in the colour bar. Note that most hippocampal sclerosis cases had concomitant Alzheimer’s disease. (C) T-map for hippocampal sclerosis compared to Alzheimer’s disease, with red-yellow indicating regions more involved in hippocampal sclerosis and blue-cyan showing areas more involved in Alzheimer’s disease. There was more medial temporal and orbitofrontal involvement in hippocampal sclerosis, and more posterior-inferior temporal, occipital and parietal involvement in Alzheimer’s disease. (D) Effect size (Cohen’s d) map for the direct comparison showing areas of greater involvement in Alzheimer’s disease, including moderate (0.5–0.8) to large (>0.8) effect sizes for the posterior-inferior temporal, occipital and parietal regions. (E) Effect size (Cohen’s d) map for the direct comparison showing areas of greater involvement in hippocampal sclerosis, including moderate (0.5–0.8) to large (>0.8) effect sizes for the medial temporal and orbitofrontal regions. Renders created using Brain Net Viewer (Xia et al., 2013) (https://www.nitrc.org/projects/bnv/).

