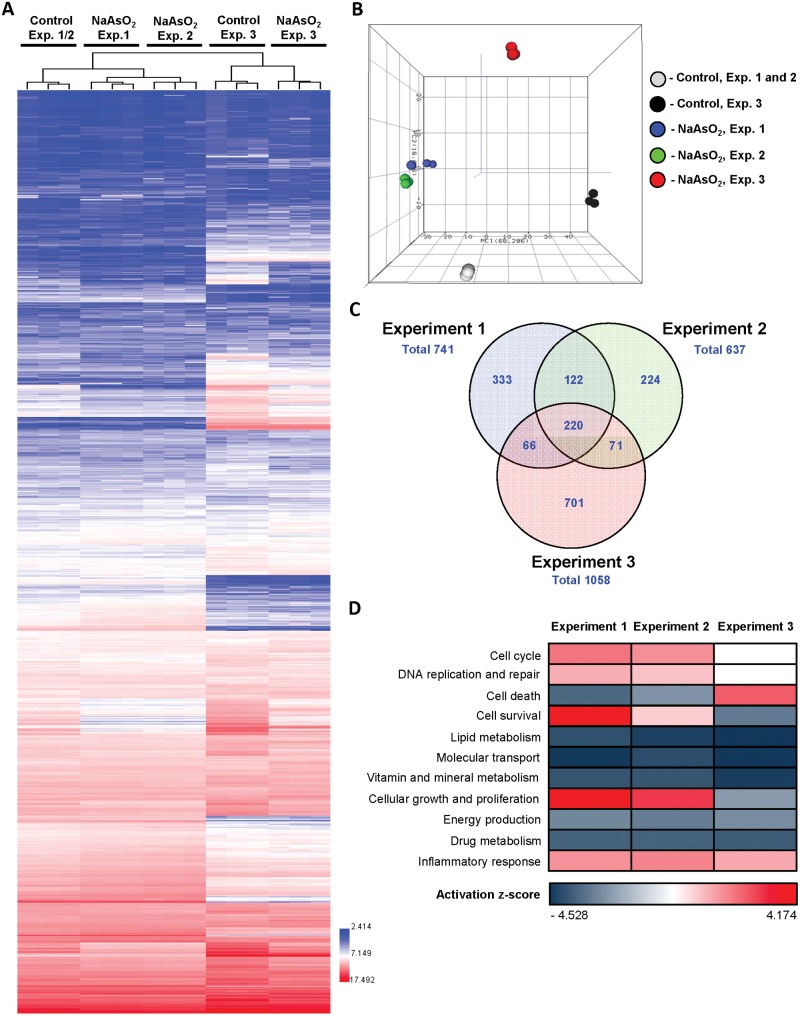
Figure 5.
Whole-genome microarray transcriptomic analysis and summary of affected molecular pathways in the HepaRG cells treated with NaAsO2. A, Heat maps and unsupervised hierarchical cluster analysis of log-normalized intensities illustrating differences in global gene expression profiles between control HepaRG cells and HepaRG cells treated with NaAsO2 in Experiments 1–3. Color bar identifies overexpressed (red) and downregulated (blue) genes. B, Principal component analysis illustrating transcriptomic differences between control and NaAsO2-treated HepaRG cells. C, Venn diagram illustrating a number of differentially expressed genes in Experiments 1–3 in NaAsO2-treated HepaRG cells as compared with control cells. D, Pathway analysis of differentially expressed genes in HepaRG cells treated with NaAsO2. Z-scores were calculated using IPA to predict activation (red) or inhibition (blue) of biological functions.

