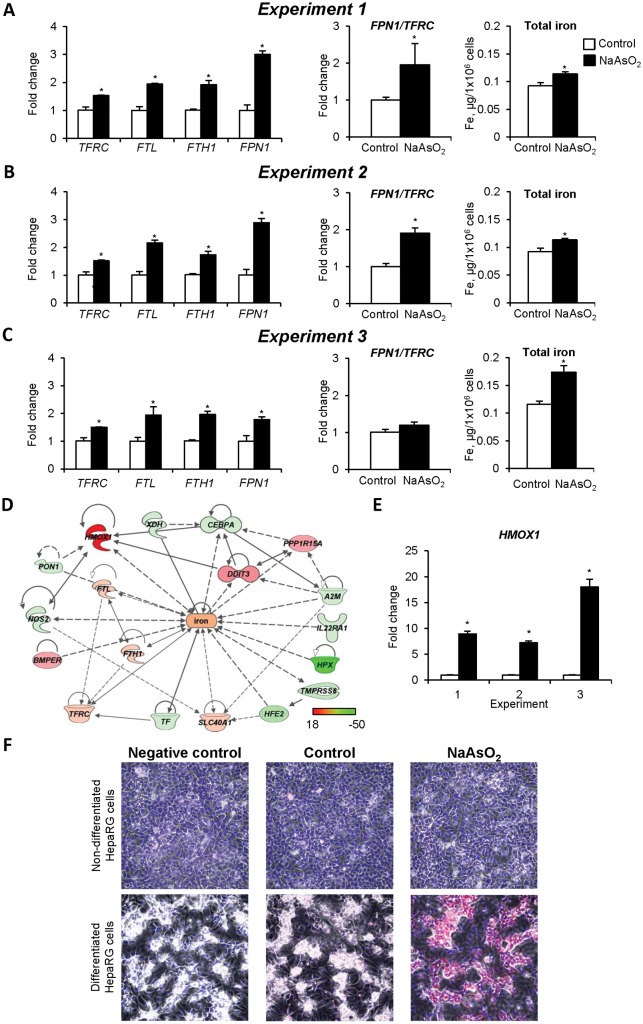
Figure 6.
Dysregulation of intracellular iron homeostasis in HepaRG cells exposed to low-dose NaAsO2. Expression of the iron metabolism-related genes TFRC, FTL, FTH1, and FPN1, FPN1/TFRC ratio, and total intracellular iron content in HepaRG cells exposed to NaAsO2 in Experiment 1 (A), Experiment 2 (B), and Experiment 3 (C). D, Molecular networks of differentially expressed genes associated with the iron-metabolic molecular pathway in HepaRG cells treated with NaAsO2. Red color indicates gene up-regulation and green color indicates gene down-regulation. E, Expression HMOX1 gene in HepaRG cells treated with NaAsO2. The data are presented as a fold change relative to control HepaRG cells, which were assigned a value 1. F, Representative images of HMOX1 staining in nondifferentiated and differentiated control HepaRG cells and cells treated with NaAsO2. The immunocytochemical analysis of the HMOX1 protein was performed as described in the “Materials and Methods” section. Positive immunostaining for HMOX1 protein is indicated by a red color. Original magnification ×200. Values are mean ± SD, n = 3. Asterisks (*) denote statistically significant (p < .05) difference from control HepaRG cells.

