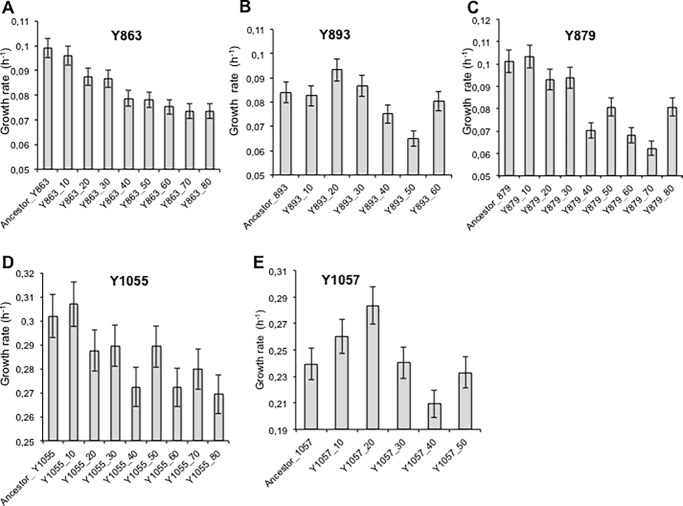
Fig 6. Growth rates variation among the evolved strains.
Growth rates were calculated from the data in Fig 3. The growth rates were calculated from turbidimetric readings acquired at OD600nm during the exponential phase (S1 File). A linear regression of log of readings was done to calculate the growth rates using Microsoft Excel. The data shown is an average of duplicate assays. A) D. anomala (Y863), B) B. custercianus (Y893), C) D. bruxellensis (Y879), D) T. pretoriensis (Y1055) and E) K. nonfermentans (Y1057). C. glabrata could not be tested using the same facilities as the species is an opportunistic pathogen. Phenotypes of L. thermotolerans (Y688) are not reported in this work whereas L. kluyveri (Y057) has been comprehensively described elsewhere [16].

