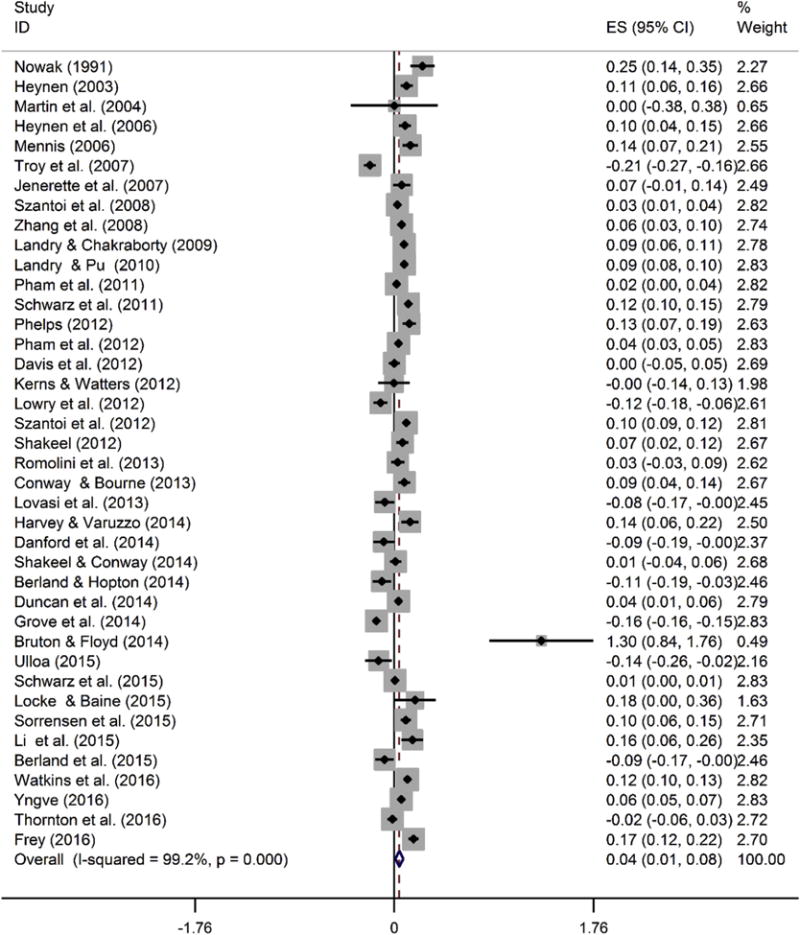
Fig. 3.

Forest Plot. Notes: black center dots (horizontal bars) represent a study’s mean effect size (95 percent confidence interval). The size of each gray box visualizes the study’s weight. The same statistics are reported in the right two columns. The bottom diamond reports the overall mean effect size and its standard error Berland and Hopton, 2014; Bruton and Floyd, 2014; Davis et al., 2012; Duncan et al., 2014; Harvey and Varuzzo, 2013; Heynen, 2003; Landry and Pu, 2010; Li et al., 2015; Lovasi et al., 2013; Lowry et al., 2012; Nowak, 1991; Perkins et al., 2004; Pham et al., 2011; Phelps, 2012; Romolini et al., 2013; Schwarz et al., 2011; Shakeel and Conway, 2014; Sorrensen et al., 2015; Thornton et al., 2016; Troy et al., 2007; Ulloa, 2015; Yngve, 2016; Zhang et al., 2008.
