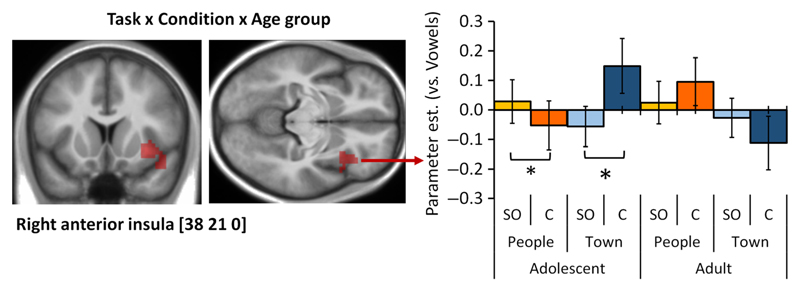
Figure 4.
fMRI results of the interaction between Task, Condition, and Age group. On the left, the right anterior insula cluster showing a three-way interaction between Task, Condition, and Age group is shown on an average structural scan of all participants in the study (left: y = 21, right: z = 0). The contrast was thresholded at p < .001 uncorrected at the voxel level, pFWE < .05 at the cluster level. On the right, parameter estimates extracted from this cluster are plotted in a bar chart to illustrate the three-way interaction. Error bars represent SE. †p < .1, *p < .05, **p < .01, ***p < .001.

