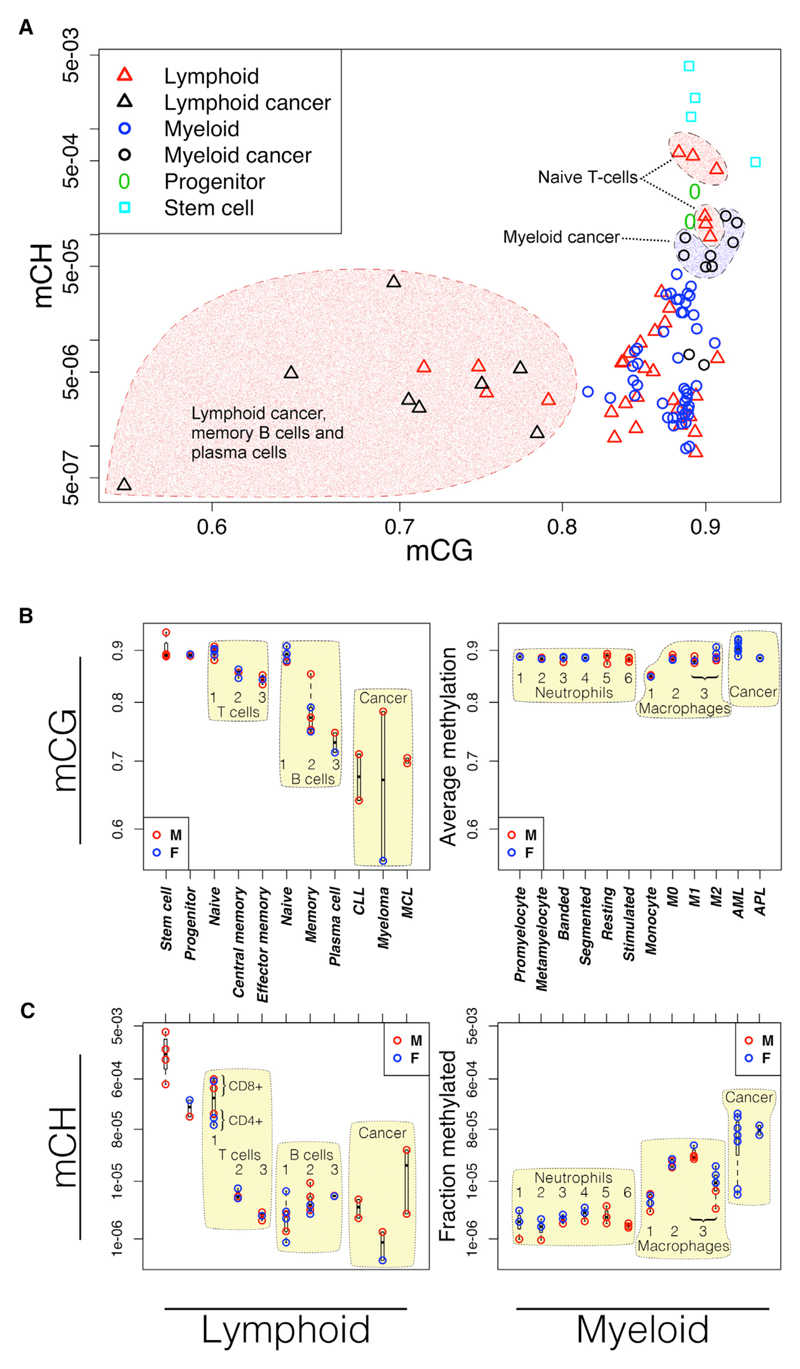
Figure 1. Genome-wide DNA Methylation Trends in Cells of the Lymphoid and Myeloid Lineages.
(A) Methylation in CH and CG contexts in lymphoid (triangles) and myeloid cells (circles). Long-lived lymphoid cells have lower CG methylation. Naive T cells have higher levels of non-CG methylation. Most myeloid-derived cancers gain non-CG methylation.
(B) CG methylation. Developing lymphocytes lose methylation (left). Cells of the myeloid lineage are relatively constant or show small gains in methylation (right).
(C) Fraction of non-CG cytosines methylated. Fraction methylated is computed as the number of significantly methylated non-CG cytosines divided by the total number of non-CG cytosines read with adequate coverage to make a methylation call, as described in Experimental Procedures. Stem cell: HUES64 cell line; progenitor: CD34+, including stem cells, multipotent progenitors, and common lymphoid progenitors. Numbers indicate developmental order relative to the indicated cell type. Blue, female; red, male.

