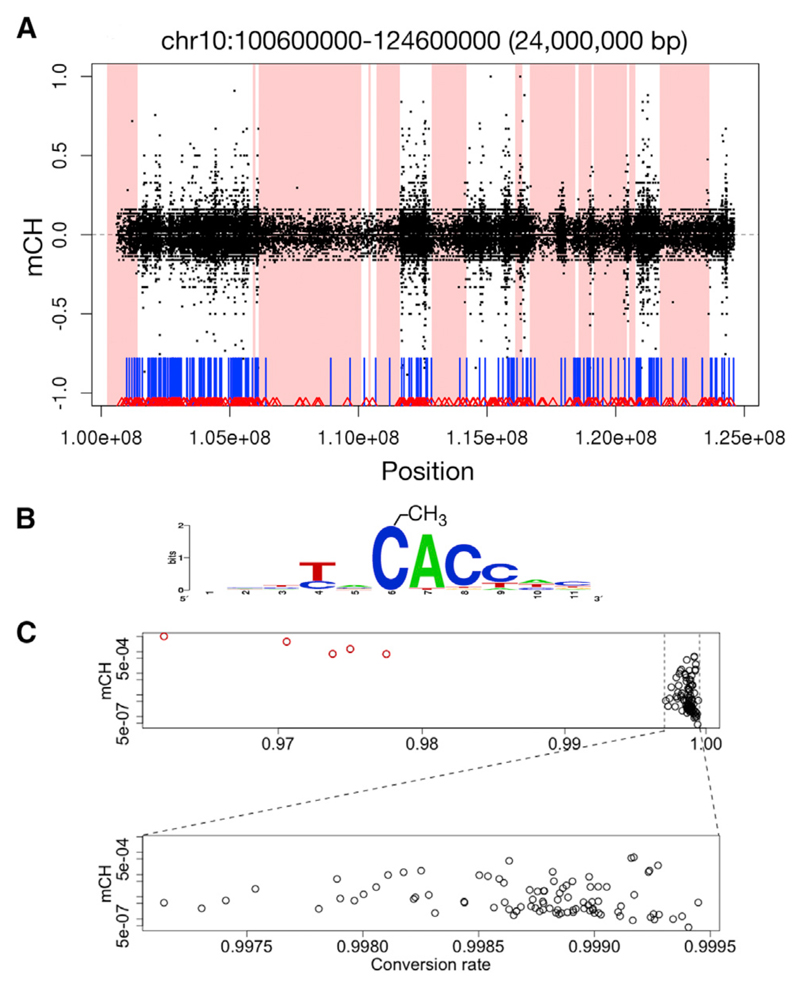
Figure 2. Non-CG Methylation.
(A) Example of mCH exclusion from lamina-associated domains (shaded areas) in a naive T cell, chr10:100,600,000–124,600,000. x axis, genomic location; y axis, non-CG methylation level (negative values, minus strand; positive values, plus strand). CpG islands (vertical blue bars) and CTCF-binding sites (red triangles) are shown.
(B) Information content in the sequence context of mCH in naive T cells. The methylated cytosine is at position 6.
(C) Conversion rate and mCH. After exclusion of under-converted outliers (red, top plot), the fraction of methylated non-CG cytosines is not influenced by conversion rate (bottom expanded plot), as determined using unmethylated spiked-in bacteriophage DNA. mCH is computed as the fraction of non-converted non-CG cytosines.

