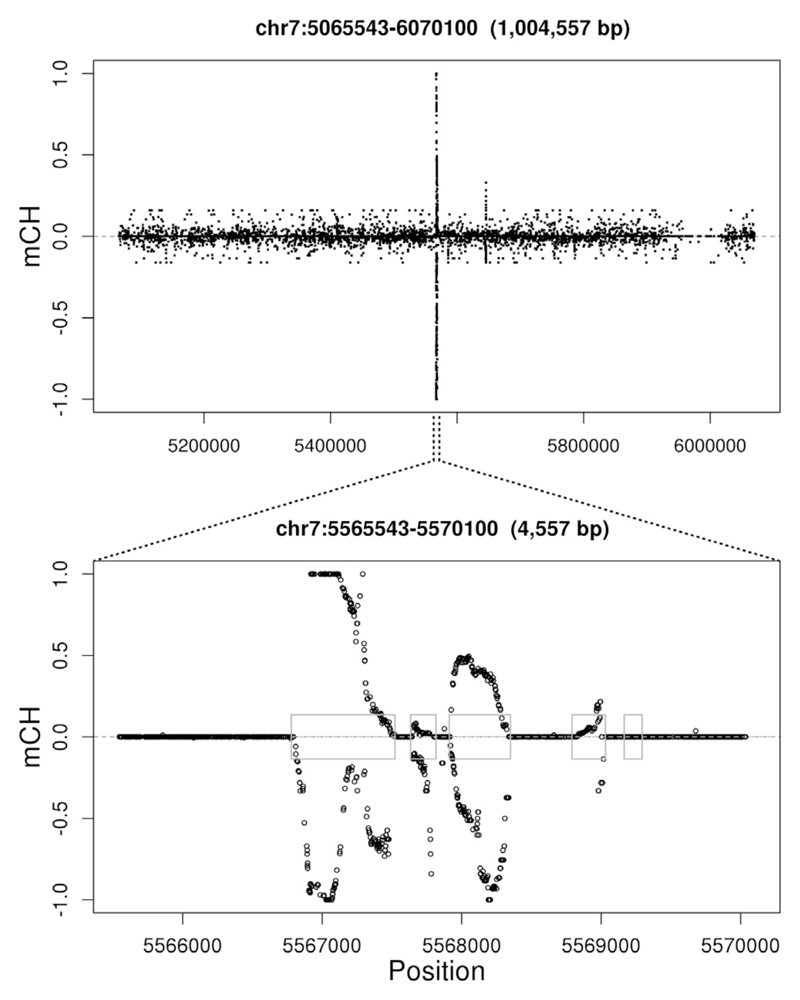
Figure 3. Exon-Specific CH Non-conversion.
Two plots at the same genomic location (x axis) at different resolutions. (Top plot) Spikes rise above background mCH levels. (Bottom plot) Spikes are specific to exons (blue boxes). y axis, fraction of non-converted reads at non-CG cytosines. Negative values indicate cytosines on the minus strand. Only positions with six or more reads informative for methylation status are shown. See also Figure S1.

