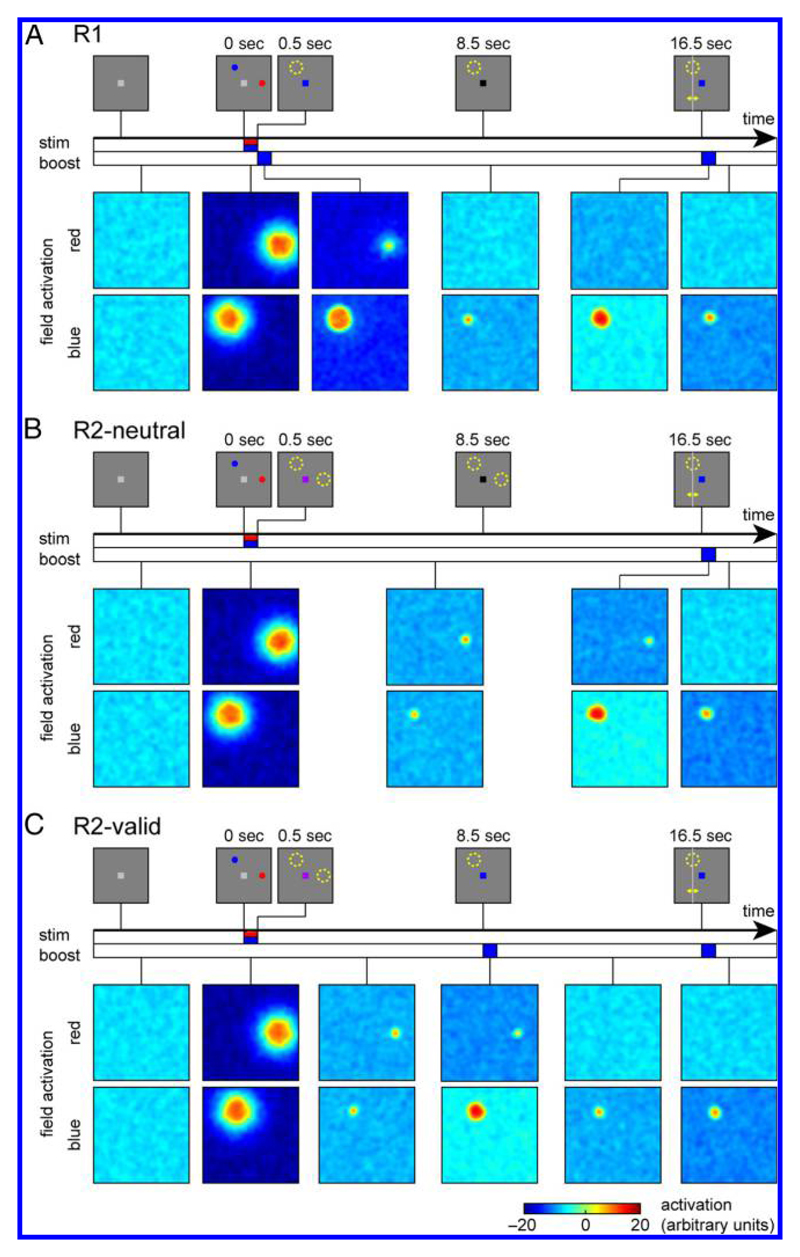
Figure 2.
Evolution of activation patterns in the neural model during a single trial in each condition. Stimulus displays during different phases of the task are shown at the top of each panel. Colored bars along the time axes indicate duration of stimulus and cue inputs in the model. Activation patterns in the two fields of the model (for colors red and blue) are shown color-coded below for different points during the course of each trial.

